Jorge Zárate / 22 August 2025
Introduction: A Level Playing Field for Tourism Insights
Why Normalization Matters in Tourism Benchmarking.
In tourism benchmarking, numbers can be misleading if we don’t compare them properly. Large destinations often dominate the charts simply because of their scale, while smaller destinations with strong growth remain hidden. To make fair comparisons, we need a method that allows us to evaluate trends and patterns side by side.
This is where normalization comes in. By rescaling data to a common reference point, normalization allows destinations of any size to be compared on equal terms. For tourism boards, travel trade partners, and policymakers, this means clearer insights and smarter strategies.
What Is Normalization in Simple Terms?
Normalization is like putting data on the same scale. Imagine you want to compare:
- Destination A: 2 million annual visitors
- Destination B: 400,000 annual visitors
Raw numbers show A as five times bigger, but what if B is growing twice as fast? Without normalization, that growth trend is easy to miss.
By rescaling all values between 0 and 1, we highlight relative changes rather than absolute size. This shows whether each destination is going up, down, or staying stable, regardless of its original scale.
The Mathematics Behind Normalization
The most common technique used in benchmarking is Min–Max Normalization, which transforms data as follows:
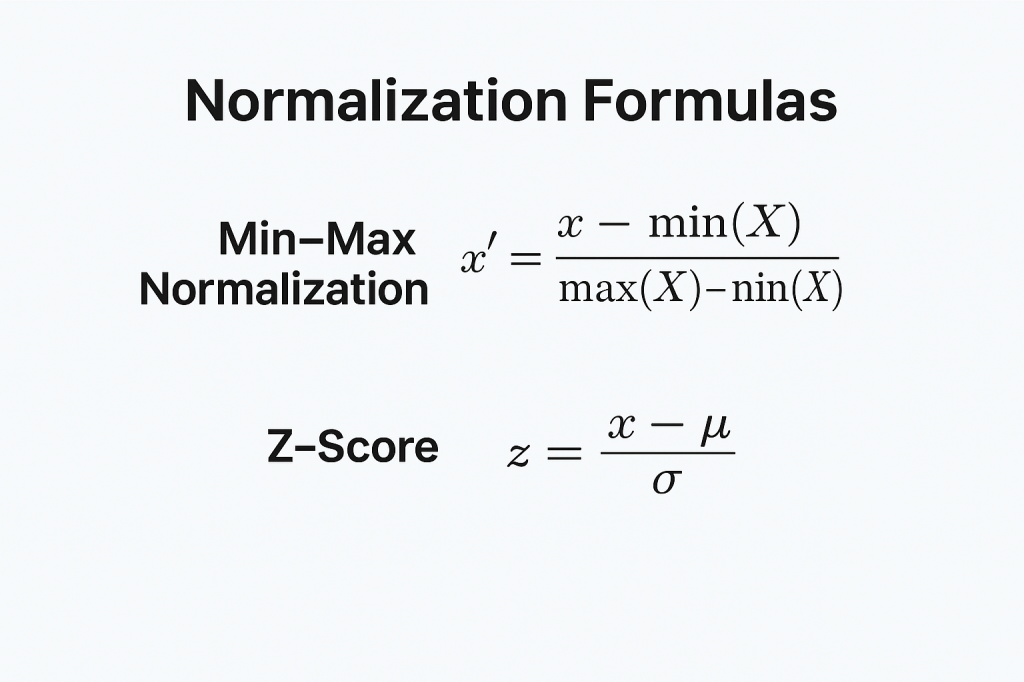
Where:
- XXX = Original value
- XminX_{min}Xmin = Minimum observed value in the dataset
- XmaxX_{max}Xmax = Maximum observed value in the dataset
- X′X’X′ = Normalized value (always between 0 and 1)
This means the lowest point in your data becomes 0, the highest point becomes 1, and everything else falls in between.
In tourism terms:
- If Destination A’s monthly Pax Count varies between 10,000 and 50,000, those values become 0 and 1.
- A month with 30,000 visitors becomes (30,000−10,000)/(40,000)=0.5(30,000 – 10,000) / (40,000) = 0.5(30,000−10,000)/(40,000)=0.5.
Now we can plot Destination A and Destination B on the same chart, making their seasonal trends instantly comparable.
Why Tourism Needs Normalization
For tourism boards and trade partners, normalization is not just a mathematical trick. It is a decision-making tool that enables:
- Fair comparisons – Put large hubs and small emerging destinations side by side.
- Seasonality analysis – Identify common peaks and low periods across markets.
- Performance benchmarking – Compare ADR (Average Daily Rate), Pax Count, and Room Nights without size bias.
- Opportunity detection – Spot hidden growth opportunities that raw numbers conceal.
Illustrative Examples (Mock Data)
Let’s use three fictional destinations — Destination A, B, and C — and compare their Pax Count, Room Nights, and ADR.
(Normalized Pax Count, Room Nights, ADR for Destinations A, B, C)

Insight from the line charts:
- Destination A shows strong winter peaks.
- Destination B remains stable year-round.
- Destination C is small in volume but growing sharply in spring months.
These patterns become visible only after normalization.
Beyond Line Charts: Alternative Visualizations
- While line charts are the most common way to show normalized trends, there are other useful approaches:
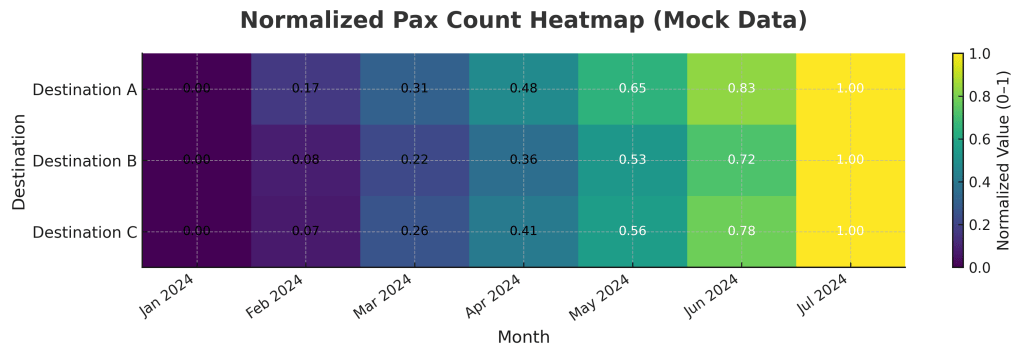
- Heatmaps – Represent seasonality across months and destinations in a grid format.
- Rows = destinationsColumns = monthsColors = intensity (normalized value)
- Scatter plots – Plot normalized ADR against normalized Pax Count to identify outliers (e.g., high ADR with low Pax).
- Stacked comparisons – Combine normalized Room Nights and ADR to reveal balance between demand and pricing strategy.
How Normalization Supports Strategic Decisions
For tourism boards, normalization means knowing whether their market is performing in line with peers. If one destination has the same normalized trend as a competitor, it may signal similar source markets or seasonal behavior.
For travel trade partners, normalization helps in:
- Targeting campaigns to match seasonal demand.
- Identifying destinations with rising ADR or growing Pax that justify new partnerships.
- Benchmarking performance without letting size distort reality.
For policy and investment, normalization reveals long-term structural trends that raw numbers blur. A small but consistently rising destination might deserve infrastructure investment, even if today’s absolute numbers look modest.
Practical Example
Imagine Pax Count data for January to June:
- Destination A: 50k → 70k
- Destination B: 5k → 10k
- Destination C: 15k → 25k
Raw data shows A as the giant. But after normalization:
- A rises from 0.0 to 1.0 (seasonal surge)
- B rises from 0.0 to 1.0 (relative doubling)
- C rises from 0.0 to 1.0 (steady upward climb)
All three destinations now show comparable growth dynamics, regardless of their absolute size.
Conclusion: Clearer Vision for Smarter Tourism
Normalization gives tourism stakeholders a clearer, fairer, and more strategic view of data. Instead of being blinded by size, we see patterns, trends, and opportunities that might otherwise remain hidden in the noise of raw numbers. This refined perspective is invaluable in a competitive landscape where understanding nuances can differentiate success from failure. For destinations large and small, it creates a level playing field for benchmarking, allowing even the smallest establishments to identify their strengths and weaknesses relative to their rivals. And for tourism boards and travel trade partners, it provides insights that support smarter strategies, enabling them to tailor their approaches more effectively to meet the dynamic needs of travelers today. Furthermore, by leveraging these insights, stakeholders can anticipate shifts in consumer behavior, enhance collaboration across sectors, and ultimately drive more sustainable tourism development that benefits local communities and the industry alike.
Next Step: Smarter Decision-Making
If your organization wants to compare destinations fairly, uncover hidden growth, and align marketing strategies with true demand patterns, normalization can be a powerful tool in your benchmarking process. By systematically adjusting data points to account for variations in factors such as seasonality, market conditions, and consumer behavior, normalization enables a more accurate comparison across different destinations. This process allows you to not only identify potential areas of opportunity but also enhances your ability to make informed decisions. Furthermore, by utilizing this method, organizations can develop tailored marketing campaigns that resonate with their target audience, ultimately driving engagement and improving overall performance in competitive markets.
