Jorge Zárate / October 2025
Introduction: Why Customer Analytics Matters in Travel and Tourism
In the dynamic and competitive landscape of global travel, tourism boards, destination marketing organizations (DMOs), and travel-trade teams are perpetually tasked with a critical, dual-pronged mission: to grow both visitor volume and visitor value while demonstrating fiscal prudence and maximizing return on investment. For decades, strategic decisions in this sector were often guided by intuition, historical precedent, and fragmented market research. Today, however, this approach is no longer sufficient. The digital transformation of the travel industry has generated a torrent of data, turning every booking, website click, and visitor inquiry into a potential strategic insight. The organizations that will thrive are those that can effectively harness this data to make smarter, faster, and more precise decisions.
The common misconception is that leveraging this data requires a team of PhD data scientists and a prohibitively expensive technology stack. This guide dismantles that myth. The strategic pressure to perform is real, but so is the advantage afforded by modern, accessible analytics tools. By adopting a simple, repeatable workflow supported by user-friendly Python libraries, tourism professionals can transform their routine booking and visitation data into a powerful source of practical direction. This process answers the most pressing commercial questions: Which source markets offer the greatest potential for growth? What specific offers will resonate with which audience? Which hotel partners should be featured in a campaign to maximize room nights? And what is the optimal timing for launching marketing initiatives?
This essay provides a comprehensive, end-to-end walkthrough of a customer-analytics pipeline, built specifically for the travel trade using the metrics that are already the lingua franca of the industry: core performance indicators like Room Nights, Number of Visitors, and Average Daily Rate (ADR), complemented by behavioral levers such as Lead Time, Repeat Rate, Mobile Share, and Promotion Share. The approach is deliberately non-technical, focusing on the “so what” behind each analytical step and directly linking the outputs to tangible, everyday decisions. While the examples will utilize a fictional dataset for clarity, the methodologies are directly transferable to any organization’s own data, typically exported as a CSV file.
We will progress through a logical sequence, starting with the foundational step of organizing your data for analysis. From there, we will explore segmentation techniques,Hierarchical Clustering and K-Means Clustering,to group similar customer segments, and Principal Components Analysis (PCA) to visualize these segments. The journey then advances into predictive modeling, covering models for Purchase Incidence, Brand Choice, and Purchase Quantity, before culminating with an introduction to Deep Learning for conversion prediction. The ultimate goal is to equip you with a practical, actionable blueprint,a playbook that can be handed to your team or partner agencies to operationalize data-driven decision-making, proving conclusively that you do not need a doctorate to deploy sophisticated analytics that drive growth.
1) Segmentation Data: What to Use and Why
The first and most critical step in any analytics pipeline is to properly structure your data. The goal here is to define a compact, consistent set of features that describe each “unit” you wish to compare and analyze. In the context of tourism, a highly useful unit is the Destination × Source Market pair. For instance, “Oregon Coast from Mexico” or “Interlaken from the UK” each represent a unique strategic entity. For each of these pairs, you will summarize behavioral data over a defined period, such as calculating monthly averages from January to September 2025.
The features you select should paint a holistic picture of both performance and behavior. They can be categorized into two groups:
Core Performance Indicators:
- Room Nights: This is your fundamental volume anchor. It quantifies the total consumption of accommodation, directly answering the question of “how much business is materializing?”
- Number of Visitors: This metric acts as a proxy for market reach or typical party size. It is often correlated with room nights but provides a distinct perspective on the number of individuals engaging with the destination.
- ADR (Average Daily Rate): As a primary value anchor, ADR signals your destination’s or partners’ quality and price positioning. A high ADR suggests a premium offering, while a lower one may indicate a value-orientated or budget-friendly segment.
Behavioral and Contextual Signals:
- Average Length of Stay (AvgLOS): This is a crucial yield indicator. Travelers who stay longer often contribute more to the local economy per trip and can influence seasonality planning and activity packaging.
- Lead Time (days): The average number of days between booking and arrival is a powerful behavioral segmenter. Early planners respond to inspirational content and early-bird offers, while last-minute bookers are driven by urgency and instant deals.
- Repeat Rate: The share of bookings from returning travelers is a direct measure of loyalty and satisfaction. This metric is invaluable for designing retention campaigns and crafting communications that reactivate past visitors.
- Mobile Share: This indicates the channel preference of a market. A high mobile share necessitates a mobile-first strategy, influencing website user experience (UX), ad formats (e.g., Instagram Stories), and even the timing of digital bids to capture on-the-go planners.
- Promotion Share: The portion of bookings involving a discount or special incentive helps measure price sensitivity and campaign effectiveness. Understanding this allows for smarter promotion planning and avoids discounting segments that are willing to pay full price.
The Practical Step: Using Python’s pandas library, you would load your raw CSV data, group it by Destination and Source Market, and compute the mean (or median) for each of these features. A crucial preparatory step before any modeling is standardization, achieved with a tool like StandardScaler. This process adjusts all features to a common scale, ensuring that a high-magnitude metric like Room Nights (e.g., in the thousands) does not disproportionately dominate the analysis compared to a lower-magnitude metric like Repeat Rate (e.g., a decimal between 0 and 1). This is essential data housekeeping that ensures the reliability and fairness of all subsequent analyses.
Use-case takeaway: A clean, well-constructed feature table is the bedrock of your entire analytics endeavor. It allows for the consistent comparison of different destination-market pairs and powers all downstream activities, from clustering to predictive modeling.
2) Hierarchical Clustering: Who Looks Alike (and Why That Matters)
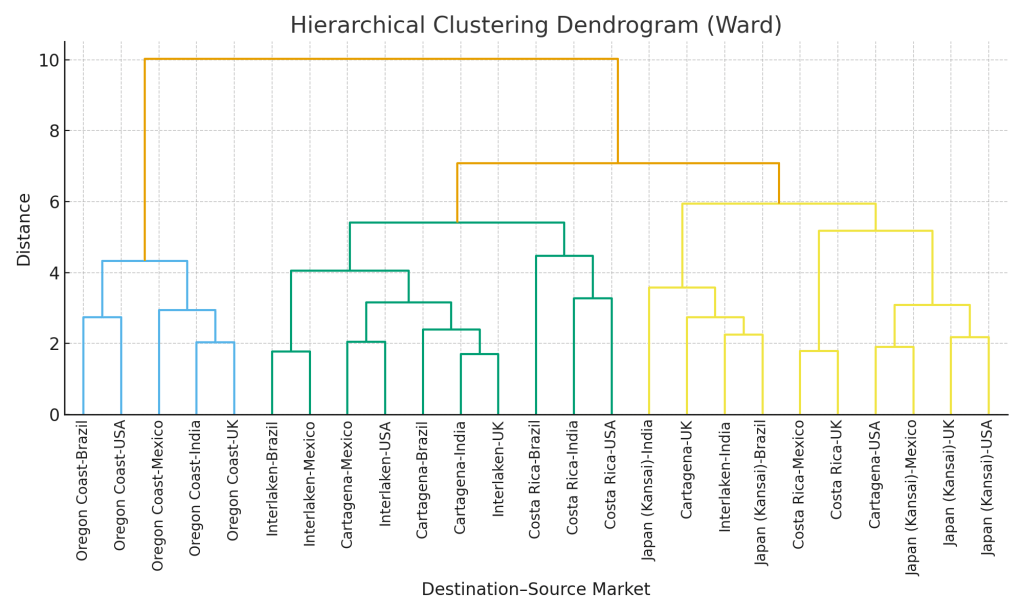
With your data standardized, the first analytical technique to apply is Hierarchical Clustering. Its primary goal is to visually discover the natural, inherent groupings within your portfolio of destination-market pairs. This method works in a “bottom-up” fashion, starting by treating each pair as its own cluster and then iteratively merging the most similar pairs into branches, and those branches into larger groups. The output is a tree-like diagram called a dendrogram.
The significant advantage of this approach is that you are not forced to pre-define the number of clusters. Instead, you can observe the entire hierarchy and “cut” the dendrogram at a level that provides a useful granularity for your business strategy.
What you get: A dendrogram provides an intuitive visual map of similarity. If the pair “Mexico → Costa Rica” sits right next to “Brazil → Costa Rica” on the tree, it indicates that these two source markets exhibit highly similar behavior when traveling to that particular destination, sharing common traits in ADR, lead times, mobile usage, and other features.
How to use it:
- Campaign Bundling: This is a primary application. You can roll out standardized training webinars, travel-trade toolkits, or co-operative marketing offers to all destination-market pairs that reside within the same branch of the tree, ensuring resource efficiency and message consistency.
- Tailored Strategies for Outliers: The dendrogram makes it easy to identify pairs that are clear outliers, not merging with any other group until the very end. These unique segments likely require highly dedicated messaging, custom product development, or further investigation to understand their distinct drivers.
Practical step: Using scipy.cluster.hierarchy.linkage (with the ‘ward’ method to minimize variance within clusters) and the dendrogram function, you can generate this tree from your standardized feature set. Begin by visually inspecting the dendrogram to identify where large vertical spaces indicate natural divisions, typically suggesting 3 to 5 primary clusters, and adjust based on your strategic need for granularity.
3) K-Means Clustering: Fast, Practical Grouping You Can Operationalize
While Hierarchical Clustering is excellent for exploration, K-Means Clustering is often the workhorse for operationalization. Its goal is to assign every destination-market pair to one of a pre-defined number of groups (k), where the members within each group are as similar as possible and the groups themselves are as distinct as possible. The output is a clear, definitive cluster label (e.g., Cluster 0, Cluster 1, etc.) for each pair, which can be easily exported to a CRM, marketing automation platform, or dashboard.
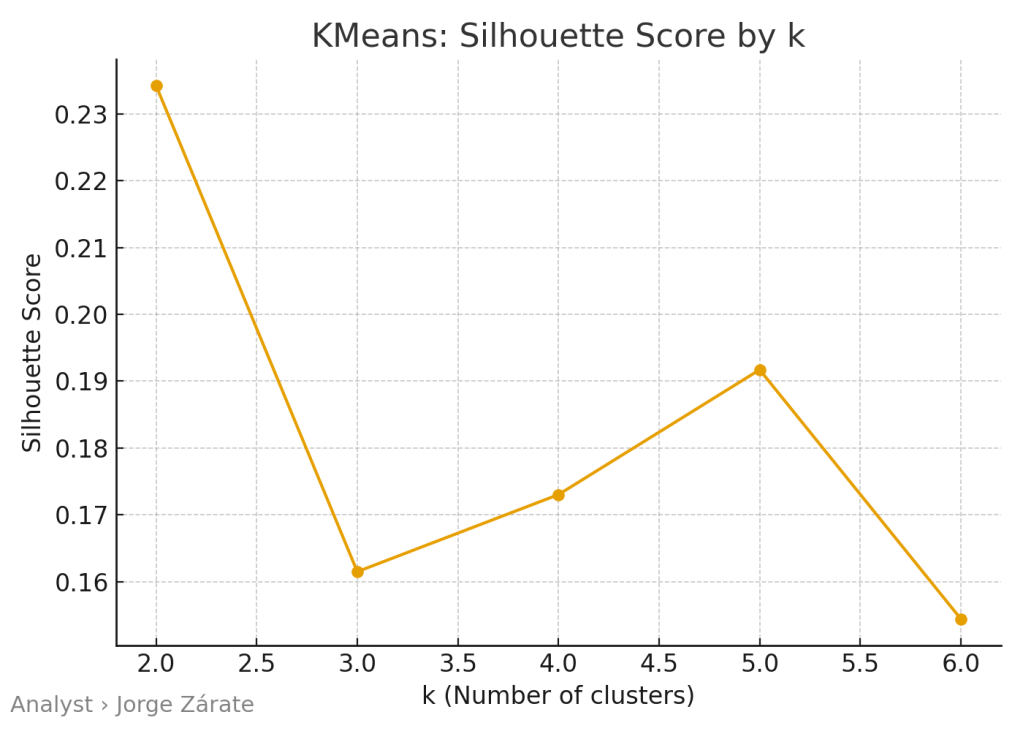
The most important decision in K-Means is selecting the right number of clusters (k). This is not a guessing game; it is guided by data-driven diagnostics:
- The Elbow Method: This involves plotting the model’s inertia (a measure of internal error) against the number of clusters. The ideal ‘k’ is often found at the “elbow” of the plot,the point where adding another cluster provides only a marginal reduction in error, indicating diminishing returns.
- The Silhouette Score: This metric quantifies how well each point fits within its own cluster compared to the nearest neighboring cluster. A higher average silhouette score indicates better, more coherent clustering.

What you get: A concise, actionable segmentation. For example, your analysis might reveal four distinct clusters:
- Cluster 0: The Planned Volume Drivers. High room nights, mid-range ADR, very long lead times. Strategy: Target with early-bird campaigns, focus on group and room-block planning with hotel partners.
- Cluster 1: The Premium Experience Seekers. Lower volume, high ADR, short stays. Strategy: Develop luxury content, forge partnerships with high-end tour operators and boutique hotels, and craft premium-branded itineraries.
- Cluster 2: The Mobile-First Deal Chasers. Mobile-heavy, highly promotion-sensitive, shorter lead times. Strategy: Push mobile-optimized promo codes, invest in last-minute deal platforms, and utilize ad formats suited for smartphone users.
- Cluster 3: The Loyal Return Visitors. High repeat rate, potentially moderate ADR and room nights. Strategy: Implement loyalty communications, exclusive “welcome back” offers, and reactivation flows to keep them engaged.
Practical step: Using sklearn.cluster.KMeans (with n_clusters=k and n_init=10 for stability), you fit the model on your standardized features. The resulting cluster labels are then saved as a new column in your original dataset, ready for immediate use by marketing and sales teams.
4) PCA (Principal Components Analysis): Seeing Segments on a 2D Map
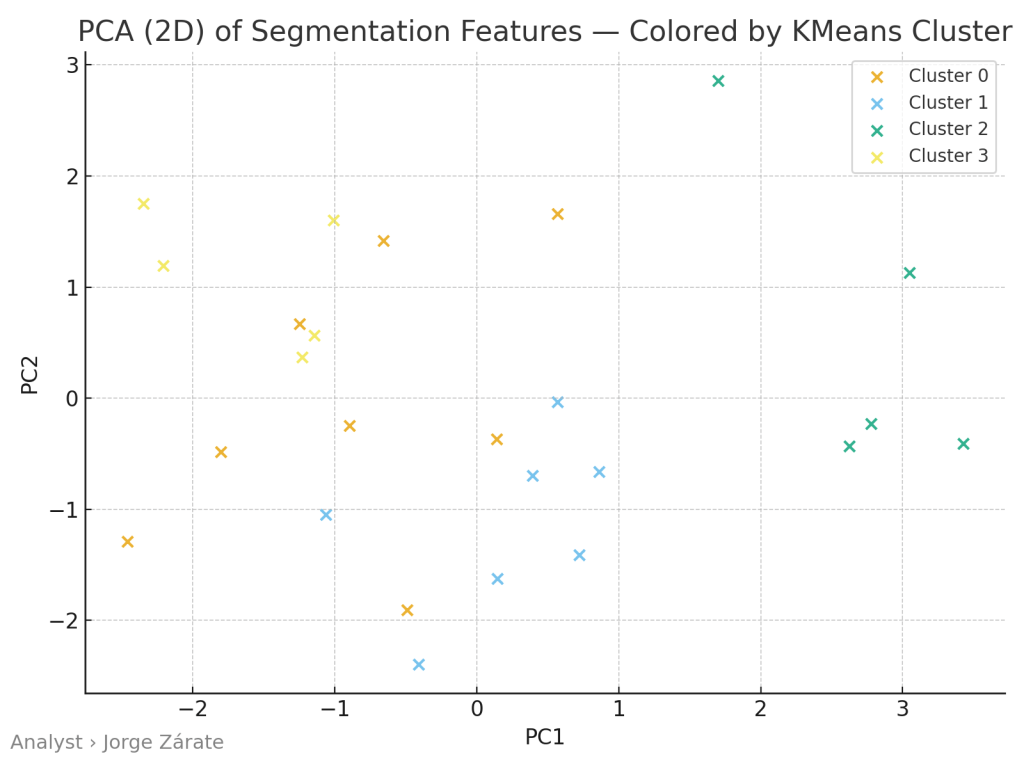
Principal Components Analysis (PCA) is not a clustering method itself but a powerful companion visualization tool. In the modern world, we often deal with many features (e.g., 7 or more), which is impossible for the human brain to visualize. PCA solves this by performing a mathematical transformation that creates new, synthetic axes,called Principal Components (PC1, PC2, etc.),that capture the maximum possible variance in the data. By plotting the data using just the first two components (PC1 and PC2), we can effectively visualize a high-dimensional dataset on a simple 2D scatter plot.
What you see: On a PCA plot, each point represents a destination-market pair. The key insight comes from observing the spatial arrangement. Points that group closely together on the 2D map are behaviorally similar and will likely belong to the same K-Means cluster. Furthermore, you can interpret the axes:
- Separation along PC1 might primarily reflect a “scale” dimension, with metrics like Room Nights and Number of Visitors having the highest influence.
- Separation along PC2 might reflect a “behavioral” dimension, driven by the mix of Repeat Rate, Mobile Share, Promotion Share, and Lead Time.
How to use it:
- Executive Communication: A PCA plot is an invaluable tool for quickly briefing non-technical stakeholders. You can show a clear visual of why your clusters are distinct and defensible, moving the conversation from abstract statistics to tangible groupings on a map.
- Cluster Validation: It allows you to spot borderline pairs that sit between two clusters, which might indicate a need to review their cluster assignment or understand their unique hybrid nature.
Practical step: Using sklearn.decomposition.PCA(n_components=2), you fit the model on your standardized features and transform them. You then create a scatter plot of PC1 vs. PC2, coloring each point based on the K-Means cluster label assigned earlier.
5) Purchase Data: What the Table Looks Like
Transitioning from segmentation to prediction requires a slightly different but equally straightforward data structure. The good news is that you do not need complex data models. A tidy, transaction-level table is sufficient to build powerful predictive models. A typical row in this table would represent a single customer’s opportunity to make a purchase (a “purchase occasion”). The columns would include:
- Customer_ID: A unique identifier for the traveler or booker.
- Session_ID / Trip_Context: Identifier for the booking session or planning window.
- Date_Time: Timestamp of the session or search.
- Destination_Market: The relevant segment the customer belongs to (often derived from the clustering exercise).
- Promo_Exposed: A binary flag (0/1) indicating whether the customer was exposed to a promotion.
- Channel: The platform used (e.g., Desktop, Mobile App, Mobile Web, Travel Agent).
- Brand_Hotel_A, Brand_Hotel_B, …, No_Purchase: A set of columns indicating which brand or hotel was chosen. Typically, these are binary, with one column set to 1 for the chosen option and all others set to 0. A separate column or a specific code would indicate a session that did not result in a purchase.
- Quantity: The number of room nights booked (0 if no purchase).
- ADR_Selected: The Average Daily Rate of the chosen option.
This structure sets the stage for the next phase of the analytics pipeline: moving from understanding who your customers are to predicting what they will do next. With this data, we can build models that answer three fundamental questions for any given customer interaction: Will they book? (Purchase Incidence), If so, which property will they choose? (Brand Choice), and How many rooms or nights will they book? (Purchase Quantity). This predictive capability, culminating in advanced techniques like deep learning, allows tourism boards to move from retrospective reporting to proactive, personalized, and profoundly more effective engagement.
In conclusion, the journey from raw data to strategic insight is both accessible and actionable for modern tourism professionals. By systematically implementing this step-by-step guide,from data preparation and customer segmentation to advanced predictive modeling,tourism boards and travel-trade teams can shed the cloak of intuition-based decision-making. They can instead embrace a culture of data-driven precision, allowing them to allocate resources smarter, design campaigns that resonate deeply, and ultimately, grow visitor volume and value in an increasingly competitive global marketplace. The blueprint is here; the tools are available. The next step is to begin.
6) Descriptive Analyses: Quick Wins and Actionable Insights
Before diving into complex modeling, the most prudent starting point is often the simplest: descriptive analytics. This foundational analysis focuses on summarizing historical data to identify patterns, trends, and anomalies that can yield immediate “quick wins.” The goal is not to predict the future but to understand the past and present with crystal clarity, providing a solid evidence base for tactical adjustments.
What to Look For:
- Seasonality Patterns: By plotting Room Nights or Number of Visitors by month or week, you can identify clear peaks and troughs. This isn’t just about knowing that summer is busy; it’s about understanding the precise magnitude and timing of demand surges for specific source markets. For instance, you might discover that the UK market consistently books coastal destinations 12 weeks in advance for summer travel, while the domestic market books only 3 weeks out.
- Channel Performance: Compare conversion rates and ADR across channels like Desktop, Mobile Web, and Mobile App. A common finding is that while mobile traffic dominates, its conversion rate is lower than desktop. This insight immediately directs investment toward improving the mobile user experience or developing a mobile-specific strategy.
- Promotion Effectiveness: Analyze the uplift in volume driven by promotions versus the potential cannibalization of full-price bookings. Calculate the net revenue impact of a promotion by comparing the promoted ADR and volume to a baseline period. You might find that certain clusters (like the “Mobile-First Deal Chasers”) are highly promotion-sensitive, while the “Premium Experience Seekers” are largely indifferent, allowing for more targeted discounting.
- Source Market Comparison: A simple dashboard comparing key metrics,Room Nights, ADR, Repeat Rate,across your source markets can immediately highlight star performers and laggards, directing your business development efforts.
Practical Step: Using pandas for aggregation and a visualization library like matplotlib or seaborn, you can quickly generate:
- Time series plots of key metrics.
- Bar charts comparing averages across channels or markets.
- Pie charts showing the share of bookings by device type.
Use-case takeaway: Descriptive analyses often provide the lowest-hanging fruit. A single afternoon of analysis can reveal that shifting 20% of a marketing budget from a low-performing channel to a high-performing one, or adjusting the timing of a campaign by two weeks to align with actual booking windows, can yield significant immediate returns. This step builds analytical confidence and creates stakeholder buy-in for more advanced modeling.
7) Modeling Purchase Incidence: Predicting the “Book vs. No-Book” Decision
The first step in predictive modeling is to tackle the most fundamental question: given a potential customer’s interaction (a website session, a brochure request, a trade show encounter), will they convert and make a booking? This is the problem of Purchase Incidence modeling. We are predicting a binary outcome: 1 for a booking, 0 for no booking.
The Model: Logistic Regression
For this task, Logistic Regression is an excellent starting point. It’s relatively simple to implement and interpret, making it ideal for a non-technical audience. The model estimates the probability of a purchase based on input features. Its output is a value between 0 and 1, which can be interpreted as the likelihood of conversion.
Input Features (Independent Variables):
- Source Market Cluster: The cluster label from the K-Means analysis. This is a powerful categorical variable that encapsulates a rich profile of the customer’s behavior.
- Channel: The platform used by the visitor.
- Promo_Exposed: Whether a promotion was shown.
- Time of Year: Seasonal indicators (e.g., month, or a flag for peak/off-peak).
- Number of Previous Visits: A proxy for customer loyalty.
Output (Dependent Variable): A binary flag indicating whether a booking occurred.
How to use it:
- Lead Scoring: Each incoming web session or inquiry can be assigned a real-time “propensity to book” score. High-probability leads can be routed for immediate follow-up (e.g., a live chat invitation, a targeted phone call from a travel trade specialist), while low-probability sessions can be nurtured with inspirational content.
- Budget Allocation: If the model reveals that visitors from “Cluster 2 (Mobile-First Deal Chasers)” have a 50% higher probability of booking when exposed to a mobile-specific promo, you can confidently allocate more budget to that specific tactic.
- Website Personalization: A visitor identified as high-propensity could be shown a simplified booking path or a reassuring message about limited availability, while a low-propensity visitor might be shown more inspirational videos and testimonials.
Practical Step: Using sklearn.linear_model.LogisticRegression, you fit the model on historical “purchase occasion” data. The model’s coefficients will tell you the direction and strength of each feature’s influence. For example, a positive coefficient for “Promo_Exposed” confirms that promotions generally increase conversion probability.
8) Modeling Brand Choice: Predicting “Which Hotel?”
Once you’ve established that a customer is likely to book, the next logical question is: which specific hotel, brand, or package will they choose? The Brand Choice model answers this. It’s a classification problem where the outcome is not binary but a category,the specific brand selected from a set of alternatives.
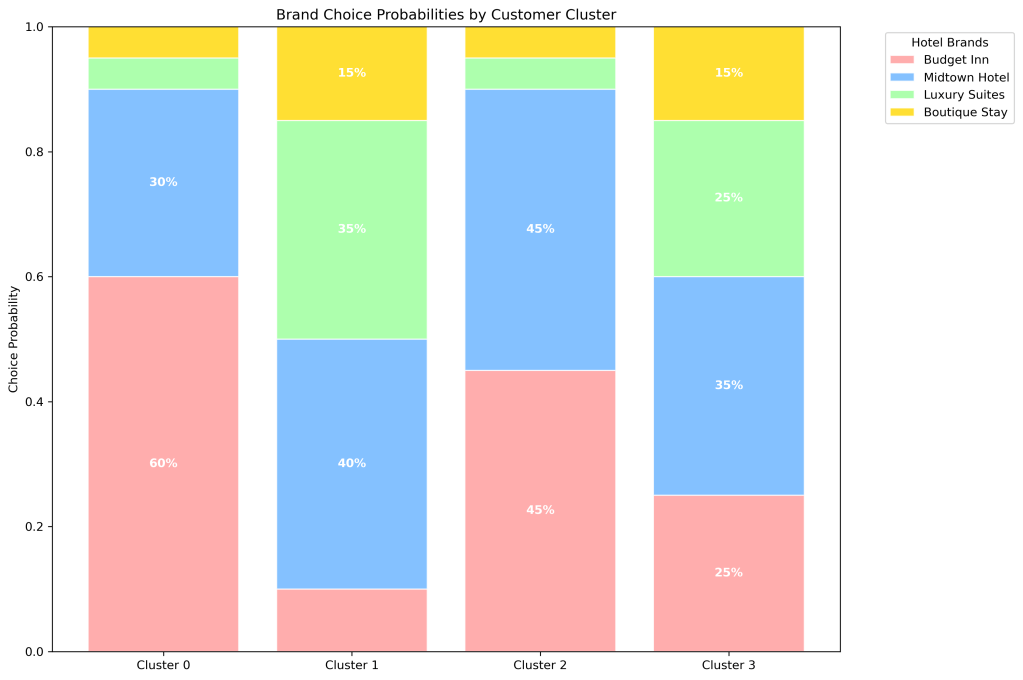
The Model: Multinomial Logistic Regression
This model is an extension of logistic regression for scenarios with more than two possible outcomes. It predicts the probability of a customer choosing each available alternative (e.g., Hotel Brand A, B, C, or none).
Input Features: These often include both customer characteristics and attributes of the alternatives themselves.
- Customer-specific: Their cluster, past loyalty to a specific brand, channel.
- Alternative-specific: The ADR of each hotel, its promotional status, its aggregate rating (e.g., TripAdvisor score), and its perceived “distance” from the customer’s ideal preference.
How to use it:
- Personalized Offers and Display: If the model predicts a 70% probability that a customer from “Cluster 1 (Premium Seekers)” will choose Boutique Hotel A, then that hotel’s offer and imagery can be featured most prominently in their browsing experience.
- Competitive Intelligence: The model quantifies the trade-offs customers make. For example, how much does a $10 increase in ADR decrease the probability of choice? How much market share does a 0.5-point increase in a review score garner? This allows for optimized pricing and partnership strategies.
- Portfolio Management: For a DMO, understanding the choice drivers between different hotel partners or regions within the destination can inform which partners to feature in international campaigns and where to invest in product development.
Practical Step: The data must be structured in a “long” format where each row represents an alternative (brand) for a given purchase occasion. Libraries like statsmodels offer robust implementations for this type of model.
9) Modeling Purchase Quantity: Predicting “How Many Rooms?”
The final piece of the purchase puzzle is quantity. For a given booking, how many room nights will be reserved? Modeling Purchase Quantity is a regression problem, as the output is a continuous number.
The Model: Poisson or Negative Binomial Regression
Since the quantity of room nights is a count (non-negative integer), standard linear regression may not be ideal. Poisson Regression is designed for such count data. However, if your data is over-dispersed (the variance is much greater than the mean), which is common in travel where party sizes vary greatly, Negative Binomial Regression is a more appropriate choice.
Input Features:
- Customer Cluster
- Purpose of Travel (if available, e.g., leisure vs. business)
- Length of Stay (which can be both an input and an output)
- Time of Year
- Whether the booking is for a group or event.
How to use it:
- Inventory and Revenue Management: Predicting the quantity of rooms likely to be booked by a segment allows hotels to manage room blocks more effectively. If a trade team knows a particular corporate client typically books in blocks of 20 rooms, they can prioritize that relationship.
- Resource Planning: A forecast of high quantity bookings for a specific period alerts destination managers to prepare for larger groups, impacting everything from airport transfers to restaurant reservations and attraction capacity.
- Upsell and Cross-sell Triggers: If a customer from a high-volume cluster is only booking a single room, it could trigger an automated offer for connecting rooms or a larger suite.
Practical Step: Using statsmodels.api.GLM (Generalized Linear Model) with a Poisson or Negative Binomial family, you can fit this model to your historical booking data, where the target variable is the Quantity column.
10) Deep Learning for Conversion Prediction: A Simple Neural Net
While the previous models are powerful and interpretable, Deep Learning (using Neural Networks) offers a more flexible, “black-box” approach that can capture extremely complex, non-linear relationships in the data that simpler models might miss. For a tourism board, a primary application is building a highly accurate conversion prediction engine.
Why Use It?
A neural network can automatically learn intricate interactions between features. For example, it might discover that the combination of “Source Market = Germany,” “Channel = Mobile Web,” and “Season = Winter” leads to a dramatically higher conversion rate than any of those factors alone would suggest. It models these complex patterns without you having to manually specify them.
The “Simple” Neural Net:
A basic feedforward neural network for this binary classification task would consist of:
- Input Layer: One node for each input feature (e.g., cluster, channel, promo status).
- Hidden Layers: One or two layers of “neurons” that perform complex transformations on the inputs. This is where the model learns its patterns. Using a library like Keras makes defining these layers straightforward.
- Output Layer: A single node with a sigmoid activation function that outputs the probability of conversion.
How to use it:
- Hyper-Personalization in Real-Time: The model’s prediction can be fed into a website’s content management system to dynamically assemble the most effective landing page for that specific user, combining imagery, copy, and offers that the model associates with a high likelihood of conversion for their profile.
- Optimizing Digital Ad Bids: The probability score can be used in programmatic advertising platforms to determine how much to bid for that specific user’s attention. A user with a 90% predicted conversion probability is worth a much higher bid than one with a 5% probability.
Practical Step: Using the tensorflow and keras libraries, you can construct and train a neural network. The process involves defining the model architecture, compiling it with an optimizer (like adam), and fitting it to your training data. It is crucial to hold out a portion of the data for testing to ensure the model generalizes well and does not just “memorize” the training data (a problem known as overfitting).
Conclusion: From Data to Direction,A Practical Blueprint for Action
The journey through this customer-analytics pipeline demonstrates a clear and attainable path from raw, unstructured data to refined, strategic direction. We began by emphasizing that the power of modern analytics is not reserved for tech giants with vast resources but is accessible to any tourism organization willing to adopt a systematic, step-by-step approach.
The workflow progresses logically:
- Foundation: We start by building a clean, standardized Segmentation Data table, the single source of truth that describes each destination-market pair through a balanced scorecard of performance and behavioral metrics.
- Understanding: We use Hierarchical Clustering to explore the natural groupings in our portfolio and then employ K-Means Clustering to assign operational, actionable segment labels. PCA provides the visual proof, translating complex, multi-dimensional data into an intuitive 2D map that anyone in the organization can understand.
- Prediction: We then shift gears to forecast future behavior. Using straightforward purchase data, we build models that answer the core commercial questions: Purchase Incidence (Will they book?), Brand Choice (Which one?), and Purchase Quantity (How much?). Each model provides levers for personalization and optimization.
- Optimization: Finally, we touch upon the advanced power of Deep Learning, a simple neural network capable of detecting subtle patterns to drive hyper-personalized marketing and maximize conversion rates.
The ultimate output of this process is not a set of complex charts or an academic report; it is a practical blueprint for action. It is a document that can be handed to a marketing team, instructing them to target “Cluster 0” with early-bird offers in Q1, to develop luxury content for “Cluster 1,” and to serve mobile-specific promo codes to “Cluster 2” during the last 72 hours before a weekend. It equips trade teams with a data-driven rationale for prioritizing partner outreach and customizing their sales pitches.
In an industry defined by competition for attention and spending, the ability to spend smarter, target more precisely, and personalize more effectively is the ultimate competitive advantage. This guide proves that this advantage is within reach. By demystifying the analytics process and linking each step directly to tangible business outcomes, tourism boards and travel-trade teams can confidently move from relying on gut feeling to being guided by data intelligence, ensuring they not only survive but thrive in the new era of travel.
11) Operationalizing the Analytics: From Models to Marketing Actions
The most sophisticated analytics pipeline is useless if its insights remain trapped in a Jupyter notebook. The final and most crucial step is operationalization,embedding the outputs of your models into daily workflows, marketing systems, and decision-making processes. This is where data science transforms into business value.
Creating the 360-Degree Customer View:
The first action is to consolidate all outputs into a single, accessible customer profile. This can be achieved by creating a master database or CRM table that links:
- Customer_ID or Session_ID
- Assigned Segment/K-Means Cluster label
- Purchase Incidence Probability Score (from Logistic Regression or Neural Net)
- Predicted Brand Choice (from Multinomial Logistic Regression)
- Predicted Quantity (from Poisson/Negative Binomial Regression)
- Key behavioral attributes (Last_Channel, Avg_Historical_ADR, Repeat_Visitor_Flag)
Integration into Marketing Automation:
This enriched customer data can be piped into marketing automation platforms (e.g., Salesforce Marketing Cloud, HubSpot) via APIs. This enables hyper-segmented campaign execution:
- Example 1: A workflow triggers automatically when a user from “Cluster 3 (Loyal Return Visitors)” has a high Purchase Incidence score but hasn’t booked in 9 months. They receive a “We Miss You” email with a personalized offer for their historically preferred hotel brand.
- Example 2: A user from “Cluster 2 (Mobile-First Deal Chasers)” browsing on a mobile device during a peak booking period (identified by descriptive analysis) is served a push notification with a time-sensitive, mobile-only promo code for hotels the Brand Choice model predicts they will prefer.
Dynamic Content on Digital Properties:
Using a tag management system and a real-time API endpoint hosting your models, you can personalize website and app content instantly:
- A high-value user (high predicted quantity and ADR) from “Cluster 1 (Premium Seekers)” might see a homepage hero section featuring luxury resorts and private tours.
- A price-sensitive user from Cluster 2 might see a prominent banner highlighting “Today’s Top Deals” and budget-friendly packages.
Sales and Trade Team Enablement:
The analytics should be translated into actionable intelligence for human teams:
- Lead Prioritization Dashboard: A simple dashboard for the travel-trade team ranks incoming leads (e.g., from trade shows) by their predicted lifetime value (a composite of incidence, quantity, and ADR predictions), ensuring they focus efforts on the most promising accounts first.
- Talking Points and Playbooks: Each cluster should have a dedicated one-page playbook. For example, the playbook for “Cluster 0 (Planned Volume Drivers)” would advise sales teams to “Focus on early-bird contracts and group booking incentives; initiate conversations 6-8 months out.”
12) Measuring Impact and Establishing a Feedback Loop
An analytics initiative is not a one-time project but an ongoing cycle. Establishing robust measurement and a feedback loop is essential for continuous improvement and proving ROI.
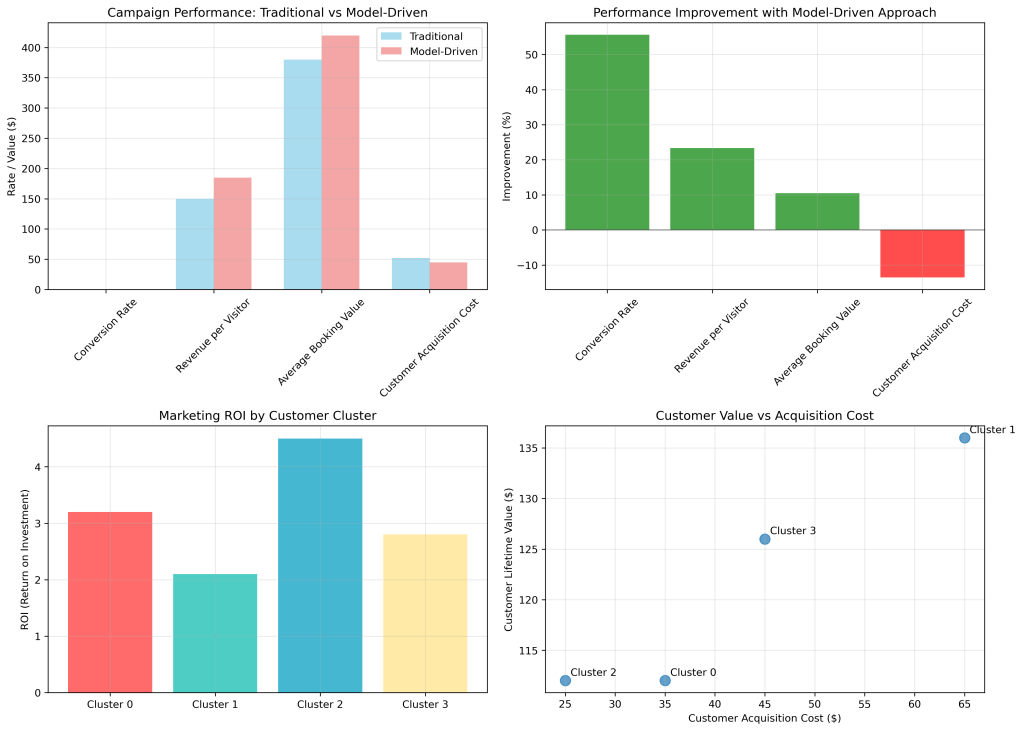
Define Key Performance Indicators (KPIs):
Link your analytical actions directly to business outcomes. For each cluster-based campaign, track:
- Uplift in Conversion Rate: Did the personalized offer for Cluster 2 increase mobile conversion by 15% as predicted?
- Incremental Revenue: Calculate the additional revenue generated from customers who converted due to a model-triggered intervention compared to a control group.
- Increase in Average Order Value (AOV): Did the premium content for Cluster 1 succeed in maintaining a higher ADR?
- Reduction in Customer Acquisition Cost (CAC): Did targeting high-propensity-to-convert segments lower the cost to acquire a new booking?
A/B Testing as a Standard Practice:
Never assume your model’s recommendation is the final word. Always test.
- For every model-driven campaign (Version A), run a control campaign (Version B) that uses the old, rules-based segmentation or a generic message.
- This rigorously validates the model’s value and provides new data to refine the next iteration of models.
The Feedback Loop:
The results of these campaigns and A/B tests are not the end. They are the beginning of the next cycle.
- Data Collection: The outcomes (e.g., did they click? did they book?) are fed back into your database.
- Model Retraining: Periodically (e.g., quarterly), your Purchase Incidence, Brand Choice, and Quantity models are retrained on this new, larger dataset that includes the results of your own marketing actions.
- Cluster Re-evaluation: As market conditions change,a new competitor emerges, a global event shifts travel patterns,the customer segments will evolve. Running the K-Means clustering annually on fresh data ensures your segments remain accurate and relevant.
This continuous cycle of Measure -> Learn -> Update -> Act ensures your analytics pipeline is a living, breathing asset that grows smarter over time, constantly adapting to the market and maximizing the efficiency of your marketing spend.
Final Synthesis: The Non-Technical Manager’s Guide to Implementation
For the tourism CEO, Marketing Director, or Head of Sales, the technical details are less important than the operational roadmap. Here is a concise, phased plan for implementation:
Phase 1: Foundation (Months 1-2)
- Assemble the Team: Identify a data-literate champion in your organization. Partner with a freelance data scientist or a tech-savvy agency if internal expertise is limited.
- Data Audit and Consolidation: Identify all data sources (booking engines, CRM, website analytics, partner reports). Export a unified CSV of destination-market data as described in Section 1.
- Quick-Win Descriptive Analysis: Perform the analyses from Section 6. Use these immediate insights to build momentum and secure buy-in from stakeholders.
Phase 2: Segmentation & Understanding (Months 3-4)
- Run Clustering and PCA: Follow the steps in Sections 2, 3, and 4. The primary goal here is to get the initial cluster definitions and a compelling visualization (the PCA plot) to align the entire organization on a new, data-driven view of the customer base.
- Develop Cluster Playbooks: Translate each cluster profile into a one-page marketing and sales strategy document.
Phase 3: Prediction & Personalization (Months 5-6)
- Build and Validate Core Models: Start with the Purchase Incidence model (Section 7). It often provides the most direct value. Then, progressively build the Brand Choice and Quantity models (Sections 8 & 9).
- Pilot a Campaign: Select one cluster (e.g., the Loyal Return Visitors) and run a small, model-informed pilot campaign. Measure its performance rigorously against a control.
Phase 4: Scale & Operationalize (Ongoing)
- Integrate with Tech Stack: Work with your IT team or agency to connect the model outputs to your CRM and marketing automation platforms.
- Establish the Feedback Loop: Implement the measurement and retraining cycle outlined in Section 12.
- Foster a Data-Driven Culture: Share successes and learnings widely. Train sales and marketing teams on how to use the new dashboards and playbooks.
Conclusion: The End of the Beginning
This guide has traversed the entire landscape of modern customer analytics for the travel trade, from the foundational principles of data preparation to the advanced frontiers of deep learning and operational integration. We have demonstrated that what might seem like an arcane, technical discipline is, in reality, a structured, logical, and,most importantly,accessible process.
The journey begins not with code, but with curiosity. It starts by asking better questions: Not “Which markets are big?” but “Which markets behave in similar, targetable ways?” Not “Did our campaign work?” but “For which specific customer segment did our campaign work best, and why?”
The techniques outlined,clustering, PCA, logistic regression, neural networks,are merely tools to answer these better questions. They are the means to an end. That end is a fundamental shift from spray-and-pray marketing to surgical, evidence-based strategy. It is the ability to know your customer so well that you can anticipate their needs, personalize their experience, and build the loyalty that turns visitors into advocates.
In the competitive, experience-driven world of travel and tourism, intuition is no longer enough. The winners will be those who learn to listen to the story their data is telling. This essay provides the dictionary to understand that language and the blueprint to build the systems that act upon it. The first step is to begin. Export your data, look at it with fresh eyes, and start asking better questions. Your most valuable customers,and your bottom line,are waiting to be discovered.
13) Overcoming Common Implementation Challenges
While the roadmap is clear, the path to becoming a data-driven organization is often fraught with practical hurdles. Acknowledging and planning for these challenges is critical for success.
Data Quality and Silos:
- The Problem: The initial data audit often reveals incomplete, inconsistent, or siloed data. Booking data sits in one system, website analytics in another, and CRM data in a third.
- The Solution: Start with a “good enough” approach. Don’t let the pursuit of perfect data paralyze you. Begin by integrating the two or three most critical data sources (e.g., booking engine and a core market list). Use a unique identifier, like an email address or a booking ID, to stitch records together. Establish a data governance policy that mandates clean data entry at the source.
Resource and Skill Gaps:
- The Problem: Many tourism boards and travel trade teams lack in-house data scientists.
- The Solution: Adopt a hybrid model.
- Upskill Existing Talent: Identify a marketing analyst or a tech-savvy manager who can learn to run pre-built Python scripts. The steps in this guide are designed to be repeatable by non-experts.
- Leverage Freelancers & Agencies: Contract a data scientist for the initial model setup and training. Once the pipeline is built, the maintenance and execution can often be handled by the upskilled internal team.
- Use No-Code/Low-Code Tools: While this guide uses Python for its power and flexibility, several platforms offer user-friendly interfaces for clustering and segmentation. The underlying logic remains the same.
Resistance to Change:
- The Problem: Sales and marketing teams may be skeptical of a “black box” model overriding their years of experience and intuition.
- Solution: Co-creation and transparency.
- Involve Teams Early: Include sales and marketing leads in the process of defining the clusters. When they help name and describe the segments (e.g., “The Luxury Explorers”), they develop a sense of ownership.
- Frame Models as Assistants, Not Replacements: Position the analytics as a tool to augment human expertise, not replace it. The model can prioritize 1,000 leads, but the salesperson’s relationship-building skills are what ultimately close the deal with the top 50.
- Show, Don’t Tell: Run a pilot campaign for a skeptical stakeholder. A side-by-side comparison showing a 30% lift in conversion for the model-driven approach is the most powerful argument for change.
14) Ethical Considerations and Data Privacy
In an era of increasing regulation (like GDPR and CCPA) and consumer privacy awareness, using customer data responsibly is not just a legal obligation but a brand imperative.
Transparency and Consent:
- Be clear with users about what data you are collecting and how it will be used to improve their experience. This information should be easily accessible in your privacy policy.
- Where required, ensure you have explicit consent for marketing personalization and data processing.
Avoiding Bias and Discrimination:
- Machine learning models can inadvertently perpetuate and amplify existing biases present in the historical data.
- Example: If a model learns that a certain postal code has a low historical conversion rate, it might systematically offer fewer premium offers to users from that area, creating a discriminatory feedback loop.
- Mitigation: Regularly audit model predictions for fairness across different demographic groups. Use techniques like “fairness-aware modeling” and ensure human oversight for high-stakes decisions.
Value Exchange, Not Exploitation:
- The goal of personalization is to create a better, more relevant experience for the traveler, not to manipulate them.
- Use predictions to inspire with content they’ll love or to save them time with relevant offers,not just to extract maximum value from every transaction. Building trust through ethical data use is a long-term competitive advantage.
15) The Future Frontier: Next Steps in Travel Analytics
The pipeline described is the foundation. As the organization matures in its analytics journey, it can explore more advanced frontiers:
Integrating Unstructured Data:
- Move beyond spreadsheets and databases. Use Natural Language Processing (NLP) to analyze:
- Customer Reviews: Uncover the specific amenities, experiences, or pain points mentioned most frequently for different segments.
- Social Media Conversations: Identify emerging travel trends, destination desires, and unmet needs in real-time.
- Competitor Intelligence: Automatically monitor and analyze the marketing messages and pricing strategies of competing destinations.
Predictive Lifetime Value (LTV) Modeling:
- Go beyond predicting a single transaction. Develop a model that forecasts the total future value of a customer or a source market. This allows for truly strategic budget allocation, where you can justify higher acquisition costs for segments that deliver superior long-term value.
AI-Driven Dynamic Pricing and Offer Generation:
- Integrate the Brand Choice and Quantity models with real-time demand signals (search volume, flight availability, event calendars) to create a system that can automatically generate and test optimized, personalized package offers with dynamic pricing, maximizing both conversion and yield.
Final Word: The Transformative Power of a Data-Driven Mindset
This comprehensive guide has provided a detailed, step-by-step framework for building a customer analytics capability from the ground up. We have moved from the theoretical “why” to the practical “how,” covering the entire spectrum from data preparation to ethical deployment.
However, the most important takeaway transcends any specific technique or model. The true transformation occurs when an organization internalizes a data-driven mindset. This is a culture where:
- Decisions are challenged with “What does the data say?” before finalizing a strategy.
- Hypotheses are tested systematically through A/B tests rather than debated in meeting rooms.
- Failure is viewed as data,an opportunity to learn and refine the next approach.
- Every team member, from the CEO to the intern, is empowered to ask questions and seek evidence in the data.
For tourism boards and travel-trade teams, this is not merely an efficiency gain. It is a paradigm shift. It is the difference between shouting a generic message into a crowded room and having a curated, personal conversation with a valued guest. It enables you to be proactive rather than reactive, to anticipate demand rather than just report on it, and to build lasting relationships rather than just process transactions.
The tools and the blueprint are now in your hands. The journey to becoming a truly intelligent, responsive, and customer-centric organization begins with a single, deliberate step: deciding to start.
No code was provided here, if interested in code please reach out, thank you.
References
Anguita, D., Ghelardoni, L., Ghio, A., Oneto, L., & Ridella, S. (2012). The ‘K’ in K-fold cross validation. In 20th European Symposium on Artificial Neural Networks, Computational Intelligence and Machine Learning (ESANN) (pp. 441-446). i6doc.com.
Bishop, C. M. (2006). Pattern recognition and machine learning. Springer.
Chollet, F., & Allaire, J. J. (2018). Deep learning with R. Manning Publications.
Hastie, T., Tibshirani, R., & Friedman, J. (2009). The elements of statistical learning: Data mining, inference, and prediction (2nd ed.). Springer. https://doi.org/10.1007/978-0-387-84858-7
Hunter, J. D. (2007). Matplotlib: A 2D graphics environment. Computing in Science & Engineering, *9*(3), 90–95. https://doi.org/10.1109/MCSE.2007.55
Jain, A. K., & Dubes, R. C. (1988). Algorithms for clustering data. Prentice-Hall, Inc.
Jolliffe, I. T., & Cadima, J. (2016). Principal component analysis: A review and recent developments. Philosophical Transactions of the Royal Society A: Mathematical, Physical and Engineering Sciences, 374(2065), 20150202. https://doi.org/10.1098/rsta.2015.0202
Kotler, P., Bowen, J. T., & Makens, J. (2014). Marketing for hospitality and tourism (6th ed.). Pearson Education.
McKinney, W. (2010). Data structures for statistical computing in Python. In S. van der Walt & J. Millman (Eds.), Proceedings of the 9th Python in Science Conference (pp. 56–61). https://doi.org/10.25080/Majora-92bf1922-00a
Pedregosa, F., Varoquaux, G., Gramfort, A., Michel, V., Thirion, B., Grisel, O., Blondel, M., Prettenhofer, P., Weiss, R., Dubourg, V., Vanderplas, J., Passos, A., Cournapeau, D., Brucher, M., Perrot, M., & Duchesnay, É. (2011). Scikit-learn: Machine learning in Python. Journal of Machine Learning Research, 12, 2825–2830.
Peltier, J. W., Schibrowsky, J. A., & Davis, J. (2020). The evolution of customer data analysis and the future of marketing. Journal of Marketing Analytics, 8(3), 119–132. https://doi.org/10.1057/s41270-020-00084-6
Schmidhuber, J. (2015). Deep learning in neural networks: An overview. Neural Networks, 61, 85–117. https://doi.org/10.1016/j.neunet.2014.09.003
Virtanen, P., Gommers, R., Oliphant, T. E., Haberland, M., Reddy, T., Cournapeau, D., Burovski, E., Peterson, P., Weckesser, W., Bright, J., van der Walt, S. J., Brett, M., Wilson, J., Millman, K. J., Mayorov, N., Nelson, A. R. J., Jones, E., Kern, R., Larson, E., … SciPy 1.0 Contributors. (2020). SciPy 1.0: Fundamental algorithms for scientific computing in Python. Nature Methods, 17(3), 261–272. https://doi.org/10.1038/s41592-019-0686-2
Waskom, M. L. (2021). seaborn: statistical data visualization. Journal of Open Source Software, 6(60), 3021. https://doi.org/10.21105/joss.03021
Wedel, M., & Kamakura, W. A. (2000). Market segmentation: Conceptual and methodological foundations (2nd ed.). Kluwer Academic Publishers.
Wolpert, D. H., & Macready, W. G. (1997). No free lunch theorems for optimization. IEEE Transactions on Evolutionary Computation, 1(1), 67–82. https://doi.org/10.1109/4235.585893
