From Visitor Volume to Value, Resource Productivity and Resilience
By Jorge Zárate
English publication version
For decades, much of international tourism policy was built around a simple idea: attract more visitors. More tourists meant more flights, more occupied hotel rooms, more restaurant business, higher consumption and, consequently, greater economic impact. Tourism boards promoted destinations; airlines transported passengers; hotels provided accommodation; and governments counted arrivals.
That model helped develop some of the world’s most successful tourism destinations. But it is no longer enough. Geopolitical conflicts can now alter air routes and energy costs within days; climate change affects water availability, wildfires, temperatures, infrastructure and insurance; housing pressure is forcing destinations to reconsider the relationship between tourism and residents; and artificial intelligence allows demand, pricing, mobility and behavior to be analyzed at a speed that was previously impossible.
Artificial intelligence is accelerating this transition. But its most important contribution to tourism may not be generating more content, images or advertising. Its greater value lies in helping destinations recognize patterns that are difficult to see manually: changes in demand, source-market behavior, price sensitivity, air-connectivity risk, resource consumption, visitor conversion and emerging pressure on infrastructure.
Combined with data science, econometrics and forecasting, AI can help transform fragmented tourism data into decision intelligence. The question is no longer simply what happened last month. Increasingly, destinations need to understand why it happened, what is likely to happen next, and which management decision could produce the best economic, environmental and social outcome.
Sustainability has also moved from the margins to the center of destination economics. According to the World Travel & Tourism Council (WTTC), Travel & Tourism accounted for 7.3% of global greenhouse-gas emissions in 2024, down from 8.3% in 2019. More importantly, the sector’s emissions intensity — emissions generated per unit of economic contribution — fell 15% between 2019 and 2024. This shows that tourism can generate more economic value with relatively less carbon, although absolute emissions must also continue to decline.
UN Tourism is moving in the same direction through frameworks that integrate the economic, environmental and social dimensions of tourism. Its ESG work explicitly includes greenhouse-gas emissions, water use, energy, waste and recycling. The principle is straightforward: if we do not measure the resources we use and the impacts we create, we cannot know whether we are actually improving.
The conclusion is fundamental: a destination can no longer be managed only as a tourism product. It must be managed as an economic, environmental, territorial and data system. That requires changing both how destinations plan and how they promote themselves.
This is the new economics of tourism: not maximizing one indicator, but continuously optimizing the relationship between demand, value, resources, connectivity, residents and risk.
1. From More Tourists to More Value per Visitor
The first transformation must take place in the indicators used to define success. If a destination received 10 million visitors last year and 10.5 million this year, the traditional headline would be 5% growth. But that number alone tells us very little.
What happened to spending? Did average length of stay increase? Did occupancy improve during the low season? How much additional water was required? How much waste did those visitors generate? How much did energy consumption increase? What happened to housing costs? How many permanent jobs were created? How much CO₂e was produced? And how much of every peso, dollar or euro spent actually remained in the local economy?
The objective should evolve from Visitor Volume toward Visitor Value + Resource Productivity + Resident Value. A destination can even receive fewer tourists and achieve a better economic outcome if it increases length of stay, visitor spending, shoulder-season occupancy and the geographic distribution of consumption.
Arrivals should therefore continue to be measured, but they should no longer be the principal measure of success. The executive question should become: how much net value does tourism generate per visitor, per night and per unit of resource consumed?
2. Sustainability in Plain Language: Use Fewer Resources to Create More Value
Sustainability is often explained in technical language that makes it sound more complicated than it is. A simpler way to understand it is to imagine a tourism destination as a very large house that receives guests every day. To look after those guests, the house needs water, electricity, food, transportation and materials. It also produces waste and emissions. If the house receives more guests every year but wastes more water, energy and food, it may look successful while its costs and problems are also growing.
The goal should not be only to receive more people. It should be to serve them better while using fewer resources for each visit. That is resource productivity.
Here is an easy example. Imagine a destination generates US$5 billion in tourism revenue and uses 30 million cubic meters of water. Divide US$5 billion by 30 million cubic meters and the result is about US$166.7 of tourism revenue for every cubic meter of water used.
Now imagine that a few years later the destination generates US$6.5 billion while still using the same 30 million cubic meters of water. Each cubic meter now helps produce about US$216.7. In simple terms, the destination is creating much more economic value with the same amount of water. Water productivity has improved by roughly 30%.
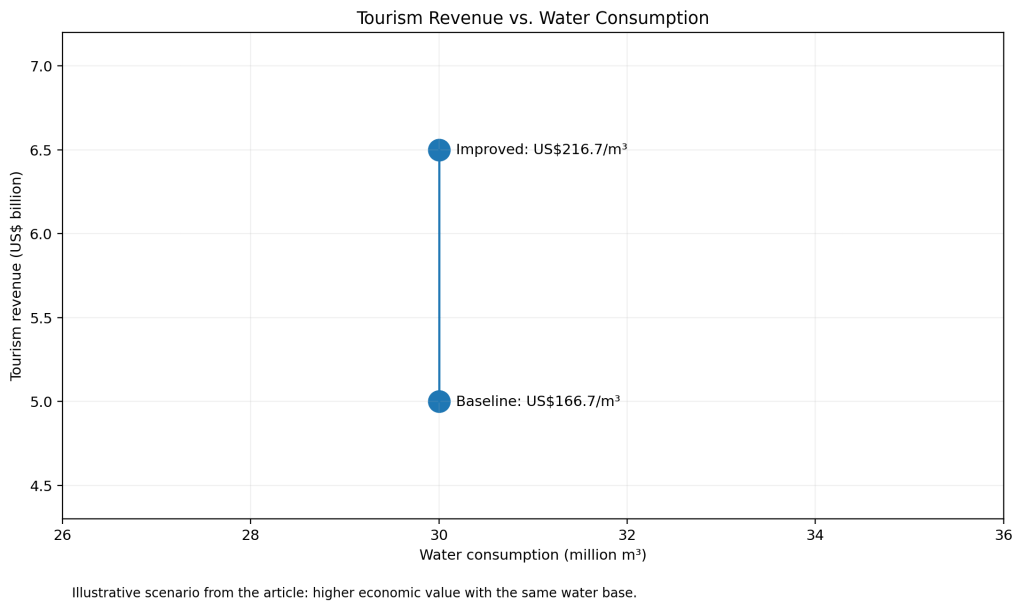
This does not mean US$216.7 is a universal target, nor that water is the only important resource. It is simply a way to understand the logic: measure how much economic value we obtain from every unit of water, energy, material or carbon used. Every destination should establish its own baseline and improve it over time.
The same logic applies to electricity. Suppose a group of hotels used 100 million kWh to support a certain level of tourism activity and later manages to produce more room nights and revenue while using 90 million kWh. It has saved 10 million kWh. If electricity costs US$0.15 per kWh, that represents US$1.5 million in lower energy expenditure. The story should always connect three things: resources saved, money saved and emissions avoided.
This is why sustainability should not automatically be presented as an additional cost. When managed properly, it can mean lower operating expenses, less exposure to resource scarcity, more efficient assets and a more competitive destination.
3. Circular Economy and Recycling: Stop Throwing Value Away
The circular economy can also be explained simply. The traditional model is: buy, use and throw away. A circular model asks a different question: before we throw something away, can we avoid buying it, use it again, repair it, transform it, recover its materials or recycle it?
Think about a hotel, restaurant or convention center. Every day, food, bottles, cans, cardboard, textiles, cleaning products and many other materials enter the operation. If everything ends up mixed in one waste container, the destination pays to buy those materials and then pays again to dispose of them. That is a double loss.
A destination should therefore measure, at a minimum, total tonnes of waste, kilograms of waste per guest night, the percentage prevented, reused, composted or recycled, and the percentage sent to landfill. Food waste per guest and per event should also be measured.
Suppose hotels, restaurants and events divert 5,000 tonnes of waste that previously went to landfill. If landfill disposal costs US$60 per tonne, the destination avoids US$300,000 in disposal costs. If separated materials such as cardboard, aluminum and glass generate another US$120,000 in recovered value, the total economic benefit associated with the program would be US$420,000.
Again, this is an illustrative example, not a universal figure. Each destination must use its actual costs. The important point is that “we recycled 5,000 tonnes” should not be the end of the story. The complete explanation is: we kept 5,000 tonnes out of landfill, avoided X in disposal costs, recovered Y in material value and reduced Z tonnes of CO₂e where that reduction can be credibly calculated.
Circularity should also extend to procurement. What percentage of food comes from local producers? How many suppliers use returnable packaging? How much furniture is repaired instead of replaced? What percentage of treated water is reused? Circular economy is not simply recycling; it is designing the system so that less waste is created in the first place.
4. CO₂: Avoid First, Reduce Next, Compensate Last
Another concept that should be communicated clearly is the difference between reducing emissions and simply offsetting them. If a hotel room leaves lights and air conditioning running unnecessarily, buying an offset afterward does not correct the original waste. The first logical action is to avoid that unnecessary consumption.
A simple hierarchy is: Avoid → Reduce → Replace → Recover → Compensate. First avoid what is unnecessary. Then reduce what is genuinely needed. Next replace technologies or energy sources with lower-carbon alternatives. Recover materials or energy whenever possible. Only after those steps should residual emissions that cannot yet be eliminated be compensated.
Imagine several hotels used 50 million kWh per year and, through insulation, efficient equipment, sensors and better operations, reduce consumption by 8 million kWh. If the electricity avoided corresponds — using the applicable emissions factor — to 3,200 tonnes of CO₂e, those are emissions avoided against the baseline. At US$0.15 per kWh, the operating saving would also be US$1.2 million.
These are teaching numbers used to show the method. A real project must use measured consumption, actual tariffs and official emissions factors. The KPI should not be a vague statement such as “we are carbon neutral,” but verifiable indicators: total tCO₂e, kg CO₂e per visitor-night, tCO₂e avoided versus baseline and the share of lower-carbon energy.
WTTC reports that transportation accounted for 40% of Travel & Tourism greenhouse-gas emissions in 2024, while utilities represented 19%. This is an important reminder that destination decarbonization cannot stop at the hotel door: air connectivity, ground mobility, energy systems and urban design are part of the same equation.
5. Water: Turn Every Liter into a Management Indicator
For many destinations — particularly islands, coastal areas and water-stressed regions — water will become one of the most important tourism KPIs of the future. The simplest explanation is this: it is not enough to know how much water the entire city used. We need to know how much water was required for each tourism night and whether that number is improving.
Suppose the baseline is 450 liters per guest per night. After improving showers, fixing leaks, changing laundry practices, optimizing irrigation and reusing water, consumption falls to 360 liters. That is 90 liters less per guest-night, a 20% reduction.
If the destination records 10 million guest nights a year, 90 liters multiplied by 10 million equals 900 million liters that no longer need to be consumed. That is 900,000 cubic meters. The percentage suddenly becomes tangible: we are talking about almost one billion liters of water avoided.
Then comes the economic question. If capturing, treating, pumping and processing one cubic meter costs US$2 in total, those 900,000 cubic meters would represent US$1.8 million in avoided cost. If the destination’s real cost is different, simply replace the number in the formula.
Useful KPIs include liters per guest-night, cubic meters per US$1,000 of tourism revenue, percentage of wastewater treated, percentage of treated water reused, percentage of landscaping irrigated with reclaimed water and water cost per occupied room. The purpose is not to fill reports with numbers. It is to identify where a critical resource is being wasted and how much that waste costs.
6. Air Connectivity Must Be Managed as a Portfolio
Recent events continue to demonstrate the fragility of connectivity. Wars, airspace closures, fuel prices, airline partnerships, fleet changes and operating restrictions can quickly alter a destination’s competitiveness.
A DMO should therefore go beyond celebrating “we secured a new route.” The better question is: what incremental economic value does this route create, and what risk does it reduce or increase? For every source market, destinations should follow an analytical chain: Demand → Seats → Frequency → Fare → Conversion → Length of Stay → Spend → Seasonality → Economic Value.
Carbon intensity can also be incorporated into mobility analysis when a consistent methodology is available. This does not mean rejecting long-haul markets. It means understanding the trade-off between economic value, connectivity and externalities.
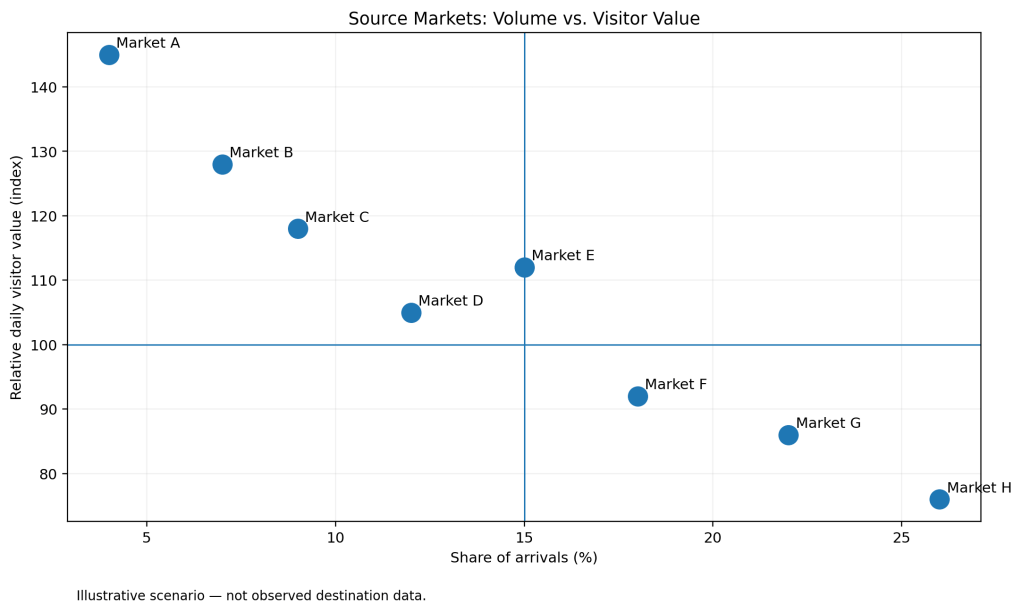
A destination may discover that one source market represents only 5% of arrivals but generates 35% more daily spending, 1.8 additional nights of stay and demand during low-occupancy months. That market may be far more strategic than a high-volume market with low spending and extreme seasonal concentration.
7. Tourism Promotion: The Event Can No Longer Be the Final Product
This is where the model needs to change radically. A tourism board attends FITUR, ITB, WTM or a commercial roadshow. It invites tour operators, travel agents, airlines and media. It shows a video, talks about the destination, distributes information, takes photographs and posts on social media. Then the event ends. Too often, the market intelligence ends there as well.
That model wastes information. An event should become a mechanism for data acquisition and commercial development, not merely exposure.
Before the event, there should be an information architecture. With consent and in compliance with applicable privacy rules, participants can provide relevant information such as market, company, segment, approximate volume, destinations sold, seasonality, customer profile, product interest, commercial intent and decision horizon.
During the event, QR codes, microsites, short surveys, digital agendas and interactive content can reveal which products generate interest. The objective is not to surveil the audience; it is to create useful interactions in exchange for voluntary and relevant information.
After the event, the most important phase begins: follow-up. Who requested information? Who opened the proposal? Which operator showed an intention to program the destination? How many meetings produced opportunities? How many opportunities became passengers, room nights and spending?
8. From CRM to Destination Intelligence CRM
A DMO should build a genuine market-intelligence database, not simply an email list. Every contact can become a structured observation: Who → Market → Segment → Interest → Interaction → Intent → Follow-up → Conversion → Value.
For example: Operator A; Spain; Luxury; interest in wellness; potential volume 1,200 passengers; travel period October–March; meeting held at FITUR; proposal sent; final result 450 passengers; 2,700 room nights; €540,000 in attributable revenue, provided the attribution methodology can support that claim.
The trade show is no longer reported as “we participated in an event.” It becomes investment → qualified leads → opportunities → conversions → room nights → economic impact. This allows destinations to compare events, markets and campaigns and decide where the next promotional peso, dollar or euro should be invested.
9. The Audience Should Participate, Not Just Receive Advertising
Modern promotion should move partly away from one-way communication. Publishing “visit our destination” is not enough. Digital interactions should also be designed to learn from the consumer.
Short surveys, quizzes, itinerary builders, inspiration tools, preference selections and personalized content can help identify what a traveler is looking for: gastronomy, culture, nature, luxury, wellness, events, family travel, adventure or sustainability; when they intend to travel; where they live; how many days they expect to stay; their approximate budget; and what type of experience they prefer.
The objective is not indiscriminate data collection. It is to obtain consented, useful and proportionate first-party data, with clear rules for privacy, retention and use. Every data point should have a business reason.
Then comes analysis: which segments convert best, which spend more, which travel outside peak season, which content creates genuine intent and which product combinations increase length of stay.
10. From Engagement to the Conversion Funnel
Likes, followers and impressions help measure reach, but they should not be the end of the analysis. Tourism promotion needs a funnel: Reach → Engagement → Qualified Interest → Lead → Booking Intent → Conversion → Stay → Spend → Return/Advocacy.
KPIs should include cost per qualified lead, lead-to-booking conversion, cost per incremental visitor, incremental room nights, incremental tourism revenue, average spend, length of stay, repeat visitation and campaign ROI.
There is also a harder question: did the visitor travel because of the campaign, or would that person have traveled anyway? That is incrementality. A/B testing, control markets, geographic experiments and econometric models can provide a much better approximation of the answer.
Promotion then stops being an isolated creative activity and becomes a commercial learning process. Every campaign should produce Brand Value + Commercial Value + Data Value.
11. Build a Tourism Data Exchange
Tourism data is usually fragmented. Hotels know some things; airports know others; airlines, OTAs, attractions, payment companies, telecommunications providers and governments hold other pieces of the story. The destination sees fragments but rarely the complete system.
The opportunity is to create, while respecting privacy, contracts and regulation, a Destination Tourism Data Exchange that integrates aggregated and anonymized information. This does not mean centralizing all personal data. It means agreeing on standards and mechanisms through which each participant can contribute to a common view without losing inappropriate control over its information.
Europe offers a useful reference for the direction of travel. The European Commission’s EU Tourism Dashboard currently contains 35 indicators and descriptors organized around the green, digital and socio-economic transitions, plus basic destination descriptors; some indicators are now available at municipal level.
An advanced destination should aim to combine official statistics with higher-frequency market signals: searches, airline capacity, fares, bookings, occupancy, mobility, aggregated spending, climate, water, energy and resident sentiment.
12. AI and Data Science: From Information to Decision Intelligence
A DMO does not primarily need artificial intelligence to write social-media captions. It needs AI and data science to answer economic questions: what will demand look like six months from now? Which market has the highest probability of conversion? Which routes are losing competitiveness? Which segments are most price-sensitive? Which campaign creates incremental visitors? Which areas are approaching critical capacity?
This is where time-series forecasting, regression, clustering, propensity models, price elasticity, anomaly detection, scenario simulation and geospatial analytics become useful. More complex models should only be used when they improve a decision; complexity is not the same as quality.
AI must move from content generation to decision intelligence. Every application should have a business case: implementation cost, expected savings, incremental revenue, model accuracy, risk and payback period.
The real opportunity begins when AI is connected to the destination’s own operating and market data. Historical arrivals, hotel performance, air capacity, fares, source markets, visitor spending, seasonality, campaign response, mobility, water, energy and other indicators can become part of an analytical environment designed to identify relationships and anticipate change.
The objective is not to ask AI to make the decision. It is to improve the evidence available to the people responsible for making it.
Where AI Can Create Practical Destination Value
Demand Forecasting. Machine-learning and time-series models can help estimate future demand by source market, season and segment, allowing destinations and tourism businesses to anticipate changes rather than simply report them afterward.
Source-Market Intelligence. AI can help identify patterns across spending, length of stay, seasonality, conversion and connectivity to determine which markets may generate greater strategic value — not necessarily which markets generate the largest number of arrivals.
Resource Optimization. Tourism activity can be analyzed alongside water, energy, waste and infrastructure indicators to identify inefficiencies, forecast resource pressure and test whether economic value is growing faster than resource consumption.
Commercial Intelligence. Campaign, CRM and conversion data can be analyzed to identify which audiences, markets, partners and promotional investments are associated with measurable economic outcomes. Where the data permit it, experimental and econometric methods should be used to distinguish correlation from incremental impact.
Risk and Resilience. AI-supported scenario analysis can help destinations explore the potential effects of changes in airline capacity, source-market demand, climate conditions, resource constraints or other external shocks.
AI, however, does not eliminate the need for statistical discipline. A model can discover patterns that are commercially interesting and still confuse correlation with causation. For that reason, Destination Intelligence should combine machine learning with econometrics, statistical testing and domain expertise. Forecast accuracy, model stability, explainability and business relevance matter more than technological sophistication for its own sake.
The analytical progression can therefore be expressed simply:
Destination Data → Data Science & AI → Decision Intelligence → Strategy → Measurable Value
Technology is not the final product. Better decisions are.
13. A New Destination KPI Framework
If we were designing a destination management dashboard for the next decade, it should combine demand, economic value, sustainability, community, promotion and resilience. No single KPI can explain the whole system; the advantage comes from connecting them.
The next step is not simply to place these indicators on the same dashboard. It is to analyze how they interact. This is where statistical analysis, econometrics and AI become particularly valuable. They can help identify relationships between source markets, connectivity, length of stay, spending, seasonality, resource intensity, resident value and resilience — relationships that may be difficult to recognize when each KPI is managed separately.
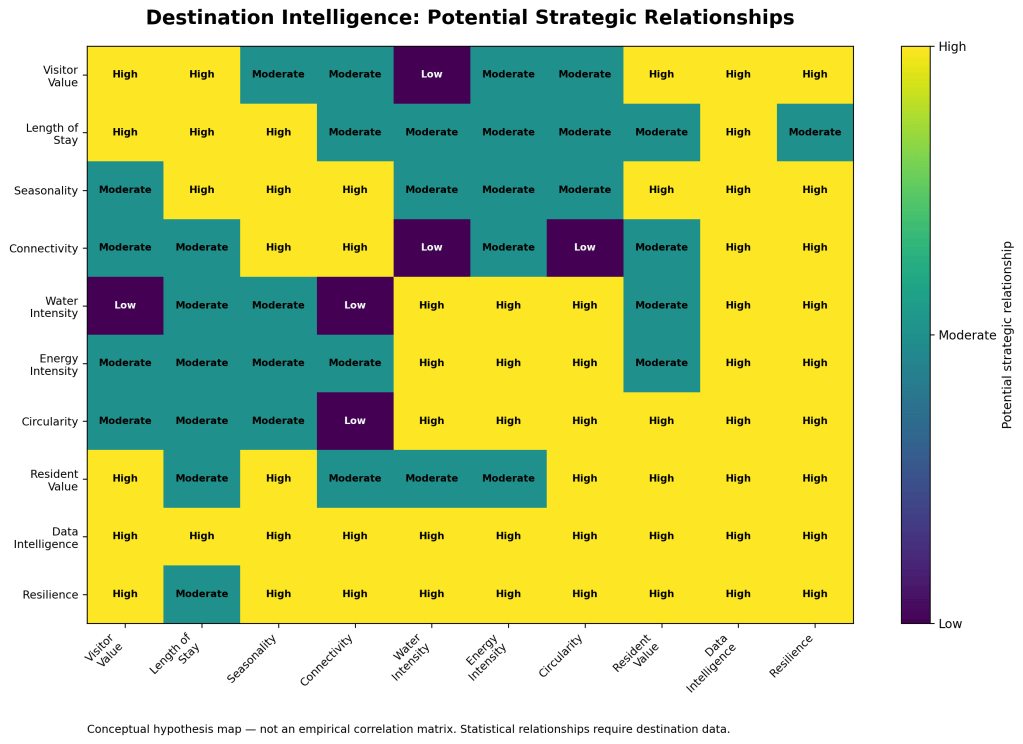
The heatmap above is deliberately conceptual. It does not present observed correlations. In a real Destination Intelligence project, these hypotheses would be tested using the destination’s own data through correlation analysis, regression, time-series methods, machine learning and other appropriate techniques.
14. The Destination Resilience Dashboard
All of these data should feed an integrated executive dashboard — not an annual report published six months after the fact, but a decision system capable of detecting change and supporting action.
It can be organized into seven layers: Demand; Value; Connectivity; Environment & Circularity; Community; Commercial Intelligence; and Risk & Resilience. Above all seven should sit Forecast + Scenario Modeling.
The dashboard should answer four questions: What happened? Why did it happen? What is likely to happen next? What should we do? That is the difference between accumulating statistics and producing intelligence.
15. Sustainability Must Also Become Part of Promotion
There is an opportunity that many destinations still underuse: communicate sustainability through results rather than adjectives. “We are sustainable” says very little. “We reduced water use per guest-night by 18% from our verified baseline” says exactly what changed.
A destination can communicate, when the figures are verified, water intensity, energy intensity, share of lower-carbon energy, tonnes of waste avoided, landfill-diversion rate, food waste reduced, tonnes of CO₂e avoided and the economic savings associated with those improvements.
The key is to tell the complete story. For example: “We use 90 fewer liters of water per guest-night; across 10 million nights, that equals 900 million liters avoided.” A 13-year-old can understand it. An investor can understand it too. Then add the actual financial saving and methodology.
Sustainability then stops being a moral obligation presented to the traveler and becomes transparency, efficiency and participation. Visitors can even be invited to choose public transport, local products, shoulder-season experiences or verified high-performing businesses, while destinations measure which options produce the strongest response.
16. The Promotion of the Future Will Be a Continuous Conversation
The major transformation is from isolated campaigns to continuous relationships. The traditional cycle was Campaign → Visitor → End. The new cycle should be Discover → Engage → Learn → Personalize → Convert → Measure → Retain → Learn Again.
Every interaction produces information. Every trip produces data. Every campaign creates an experiment. Every season allows the models to be recalibrated. The destination begins to learn — and the more it learns, the better it can allocate budget, capacity, infrastructure and resources.
A campaign can be copied. A video can be copied. A slogan can be copied. A knowledge base built over years around behavior, demand, connectivity, sustainability and conversion is much harder to copy. It can become one of a DMO’s most valuable assets.
Conclusion: From Destination Marketing to Destination Intelligence
Tourism is entering a different stage. Success should no longer be defined by another annual visitor record. The real question is: are we generating more value while using resources more efficiently and increasing the destination’s resilience at the same time?
That requires integrating economics, aviation, technology, sustainability, circular economy, infrastructure, housing, mobility and community. It also requires abandoning the idea that sustainability means only reducing environmental impact.
Properly managed sustainability means less energy and lower cost; less water and greater resilience; less waste and higher productivity; more recycling and reuse and lower resource dependency; less CO₂e and lower climate and regulatory exposure; more local procurement and greater economic retention; and better information for better decisions.
Promotion must evolve as well. It is no longer enough to attend a trade show, organize an event, buy a campaign, produce a video and count attendees. Every promotional action should produce three outcomes: Brand Value + Commercial Value + Data Value. If it produces only visibility, much of its potential is being wasted.
The destination of the future will use every interaction to understand its market better, every campaign to experiment, every event to generate commercial intelligence and every visitor to understand the relationship between revenue and resources.
The conceptual evolution is therefore: Destination Marketing → Destination Management → Destination Intelligence.
And the new equation for success is: Visitor Value + Resource Productivity + Resident Value + Data Intelligence = Destination Resilience.
The competitive destination of the future will not necessarily be the one receiving the most tourists. It will be the one capable of identifying which visitors create the greatest value, attracting them at the right time, measuring how much they truly leave in the local economy, managing water, energy and materials efficiently, reducing emissions and waste, protecting its community, turning promotion into information and using that information to predict what it should do next.
We do not simply need destinations that are promoted more aggressively. We need destinations that learn, measure, optimize and regenerate. When tourism, circular economy, data science, connectivity and investment are managed within the same model, sustainability stops looking like an additional cost. It becomes productivity, competitiveness and economic value.
| Dimension | Priority KPI | Management question |
|---|---|---|
| Demand | Arrivals, room nights, LOS | How much demand and how many nights are we generating? |
| Economic Value | Spend/visitor, ADR, RevPAR, tourism revenue | How much economic value does demand create? |
| Seasonality | Monthly demand concentration | How dependent are we on a few peak months? |
| Connectivity | Seats, routes, frequency, fares | How accessible and diversified is the destination? |
| Carbon | kg CO₂e/visitor-night; tCO₂e avoided | How much carbon does activity generate, and how much do we avoid? |
| Energy | kWh/guest-night; low-carbon energy share | Are we using less energy and cleaner energy? |
| Water | liters/guest-night; m³ avoided/reused | How much water is required for each tourism night? |
| Circularity | waste/guest-night; diversion & recycling rate | How much waste do we prevent and recover? |
| Food | food waste/guest-night | How much food ends up being wasted? |
| Local Economy | % procurement from local suppliers | How much tourism spending remains locally? |
| Community | housing pressure, wages, resident sentiment | Does tourism improve or weaken local quality of life? |
| Mobility | public/low-carbon visitor transport share | How do visitors move within the destination? |
| Marketing | qualified leads, conversion, CAC | Does promotion create intent and customers? |
| Commercial | campaign-attributable room nights/revenue | What value can be attributed to commercial investment? |
| Resilience | climate, connectivity & source-market concentration | How vulnerable is the destination to shocks? |
| Data | % ecosystem providing usable data | How complete is our decision-making capability? |
Methodological note on figures and calculations
Figures attributed to external organizations are presented as documented evidence and are supported by the APA 7 references listed at the end of the article.
Examples such as 450 to 360 liters per guest-night, US$60 per tonne of waste, US$0.15 per kWh, 5,000 tonnes diverted from landfill and similar exercises are teaching examples created to explain how the KPIs work. They are not observed results from a specific destination.
When a figure is produced through arithmetic from an illustrative scenario — for example, 90 liters × 10 million guest nights = 900 million liters — it should be understood as an illustrative author calculation. In a real application, these values must be replaced with verified baselines, actual tariffs, official emissions factors and destination operating data.
This distinction separates clearly: (1) documented external evidence, (2) derived calculations and (3) teaching scenarios.
References
European Commission, Directorate-General for Mobility and Transport. (2025, December 15). Updated facts and figures on EU tourism available now. European Commission. https://transport.ec.europa.eu/news-events/news/updated-facts-and-figures-eu-tourism-available-now-2025-12-15_en
European Parliament & Council of the European Union. (2024). Regulation (EU) 2024/1028 of 11 April 2024 on data collection and sharing relating to short-term accommodation rental services. EUR-Lex. https://eur-lex.europa.eu/legal-content/EN/TXT/?uri=CELEX:32024R1028
UN Tourism. (n.d.). ESG framework for tourism businesses. UN Tourism. https://www.unwto.org/es/estadisticas-turismo/esg-empresas-turisticas
World Travel & Tourism Council. (n.d.). Environmental & Social Research (ESR). WTTC. https://wttc.org/research/environmental-social
 Jorge Zárate