
From Linear Decisions to Productive Systems
How Systems Thinking and System Dynamics Improve Organizational Performance
by Jorge Zárate
What Problems It Would Help Solve
This approach would be especially valuable when an organization faces situations such as:
- It reduces costs but subsequently loses quality, capacity, or revenue.
- It hires more employees, but productivity does not improve.
- It increases sales without developing sufficient operational capacity.
- It implements immediate solutions that make the problem more serious in the future.
- Its departmental indicators are positive, but overall organizational performance remains poor.
- It launches promotions that generate visibility but fail to produce conversions.
- It invests in technology without achieving adoption or a satisfactory return.
- It establishes conflicting goals across sales, operations, finance, and customer service.
- It experiences recurring cycles of overload, errors, pressure, and employee turnover.
- It needs to evaluate a strategy before committing significant resources.
Causal loop diagrams enable an organization to make its assumptions about how a problem is produced explicit and to identify reinforcing and balancing loops. They also help reveal differences among the mental models held by different functional areas.
Other problems systems thinking can help solve
- Recurring problems that return after an apparently successful fix
- Short-term improvements that create larger long-term costs
- Backlogs, rework, burnout and declining service quality
- Growth that stalls because demand expands faster than capacity
- Oscillation between overstaffing and understaffing, excess and shortage, or expansion and cuts
- Conflicting departmental decisions that optimize local metrics while weakening overall performance
- Cost reductions that unintentionally erode capability, customer value or resilience
- Technology and artificial intelligence investments that underperform because the problem, workflow or adoption system was poorly defined
- Strategies whose effects arrive too late, appear in another part of the organization or trigger resistance
- Decisions made under uncertainty where feedback, delays and unintended consequences matter
These problems differ in surface detail, but they share a common feature: the outcome is produced by relationships across time, functions and decisions rather than by one isolated cause.
Organizations rarely fail because managers are inactive. More often, they struggle because actions that appear reasonable in isolation interact with other decisions, constraints, incentives and delays in ways that no department fully anticipates. A cost reduction improves this quarter’s financial result but weakens service capacity. A sales campaign generates demand faster than operations can absorb it. Employees work harder to clear a backlog, yet fatigue produces errors that create even more work. New technology is introduced to improve productivity, but inadequate training initially reduces output and causes leaders to withdraw support before the benefits can emerge.
These are not simply execution problems. They are systemic problems. Their causes are distributed across time, functions and relationships, while conventional management tends to divide the organization into departments, indicators and individual decisions. Systems thinking offers a different perspective: it examines how the structure of relationships produces patterns of behavior. System dynamics extends that perspective by representing feedback, accumulations and delays in models that can be tested over time.
This distinction matters for productivity. Productivity is frequently managed as a ratio – output divided by labor, time or cost. The calculation is useful, but it does not explain what generates the numerator or denominator, why performance changes, or what an intervention will do after its immediate effect has passed. Sustainable productivity is an emergent outcome of a wider system that includes capacity, workload, skills, process quality, demand, investment, morale, technology and managerial expectations.
This essay develops a practical framework for diagnosing organizational performance by combining causal-loop thinking, learning in complex systems and the integration of system dynamics with decision analysis. Its central argument is that leaders improve productivity not by maximizing isolated components, but by redesigning the feedback structures that repeatedly create performance.
The limits of linear management
Linear reasoning follows a familiar sequence: identify a problem, determine its apparent cause, implement a solution and measure the result. This approach works well when relationships are stable, effects are immediate and the intervention does not materially alter the conditions surrounding it. Many operational tasks meet those conditions. Complex organizations often do not.
A system can be understood as a community of connected entities. Knowledge of the individual entities is insufficient to predict the behavior of the whole because connections create properties that do not reside in any component separately. A business may employ competent people, use capable technology and serve a growing market, yet still experience declining quality because the timing and interaction of those elements create overload.
A central challenge is policy resistance: interventions are absorbed, offset or redirected by the system’s own responses. Managers attempt to change an outcome, but employees, competitors, customers, suppliers and internal processes react. The intervention changes the environment in which it operates. Consequently, the final result can be smaller than expected, delayed, temporary or opposite to the original intention.
Three features make linear reasoning particularly unreliable.
First, cause and effect may be distant in time. Training reduces productive hours today but raises capability later. Deferred maintenance protects cash now while increasing failures in the future. Leaders often attribute the delayed result to the conditions prevailing when it becomes visible, not to the earlier decision that generated it.
Second, cause and effect may be distant in organizational space. Commercial incentives raise sales, while their consequences appear as congestion in operations, complaints in customer service or working-capital pressure in finance. Each department sees an internally coherent fragment, but no fragment explains the organizational outcome.
Third, feedback makes causality circular. Demand affects capacity decisions; capacity affects service; service affects reputation; reputation affects demand. Asking which single variable is the cause misses the structure. The useful question is which feedback processes dominate behavior under particular conditions.
Systems thinking and system dynamics are related but not identical
Systems thinking is a way of framing and investigating complexity. It widens the boundary of analysis, focuses on relationships rather than isolated events, examines patterns through time and challenges the mental models through which decision makers interpret a problem. Its value lies partly in making assumptions discussable.
A causal loop diagram is one of its most useful tools. Variables are connected by arrows indicating hypothesized causal influence. A positive polarity means that, all else equal, a change in the cause moves the effect in the same direction relative to what it otherwise would have been. A negative polarity means that the effect moves in the opposite direction. Polarity does not mean beneficial or harmful. It describes direction.
When the links close into a loop, the loop can be reinforcing or balancing. Reinforcing loops amplify change: they can generate virtuous growth or vicious decline. Balancing loops oppose change and move a system toward a target, constraint or equilibrium. Delays indicate that an effect is not immediate and are essential because they can produce overshoot, oscillation and premature policy reversal.
System dynamics is more demanding. A formal model identifies stocks – accumulations such as employees, backlog, installed capacity, customer base or cash – and the flows that increase or decrease them. It specifies equations, initial conditions, decision rules, nonlinear relationships and delays. Simulation then reveals whether the proposed structure can reproduce the behavior of interest and how alternative policies perform across time.
The distinction protects analytical integrity. A causal diagram is a structured hypothesis, not proof of causality. Statistical analysis can test selected relationships in observed data, but correlation alone does not capture a feedback system. A simulation can evaluate dynamic consequences, but only within its boundary and assumptions. Used together, qualitative mapping, empirical analysis and simulation provide a stronger decision process than any one method alone.
Productivity as a feedback system

Editorial image. The fast cycle of pressure and rework contrasted with the slower path of learning and capability building.
Consider a service operation facing a growing backlog. The immediate managerial response is usually to demand greater effort, extend working hours or reduce staffing cost. These actions can temporarily raise completed work. However, sustained workload pressure causes fatigue. Fatigue increases errors. Errors require correction and reprocessing, which add to the backlog. The apparent solution becomes part of the mechanism producing the problem.
Figure 1. Workload pressure and the rework trap
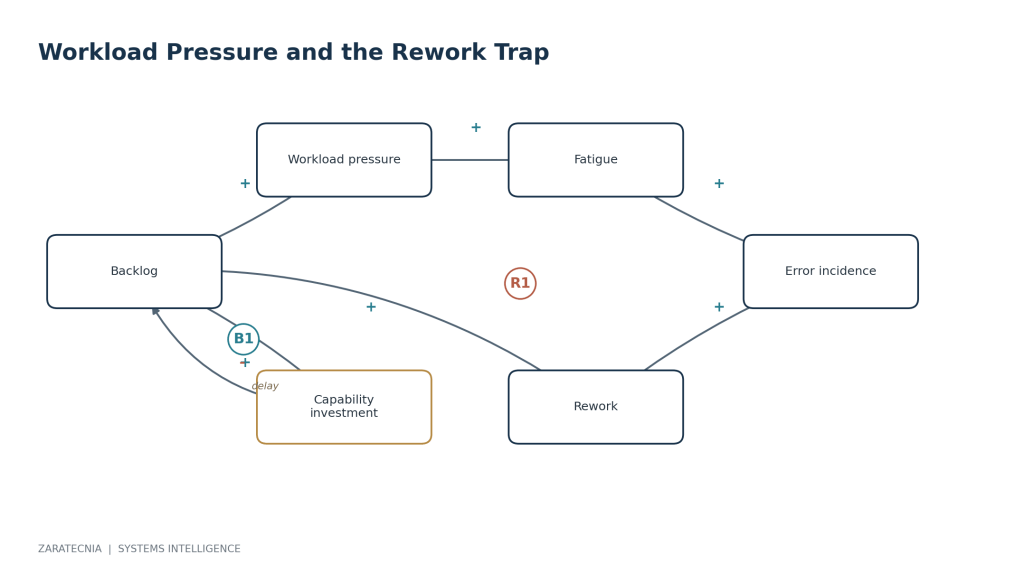
R1 is a reinforcing loop; B1 is a balancing response. The delay marks the time required for staffing or capability to become effective.
The reinforcing rework loop can be expressed as follows: backlog raises workload pressure; pressure increases fatigue; fatigue increases error incidence; errors generate rework; rework adds to backlog. Management’s balancing response attempts to reduce the gap between desired and actual service capacity by hiring, training, redesigning work or adding technology. Yet these interventions have delays. If leaders ignore those delays, they may cancel the capability investment while intensifying the short-term pressure that drives the reinforcing loop.
This interpretation changes the productivity question. Instead of asking, “How can each employee process more transactions this week?” management asks, “Which structure is generating avoidable work, and which intervention reduces total workload over the relevant horizon?” The first question may increase apparent productivity while degrading the system. The second targets the source of lost productive capacity.
Useful measures should therefore include not only units per labor hour, but also first-time-right performance, rework, age of backlog, overtime, absence, turnover, training time, process variability and time to competence. The objective is not to maximize every metric. It is to understand how they interact and which combination indicates a healthier system.
Quality and cost are dynamically connected
Cost and quality are often presented as competing objectives. An example from the television industry shows why this framing can be misleading. Cost reduction may increase short-term funds or margins, but if it reduces the resources required for creative and operational quality, customer response can weaken. Lower demand then reduces revenue and creates pressure for further cuts. A decision intended to protect performance initiates a reinforcing decline.
The opposite path is also possible. Investment in quality can improve customer experience, strengthen reputation, increase demand and create resources for further improvement. Both virtuous and vicious circles share the same reinforcing structure; direction depends on the initial movement, loop strength and constraints.
Figure 2. Quality investment and the cost cutting spiral
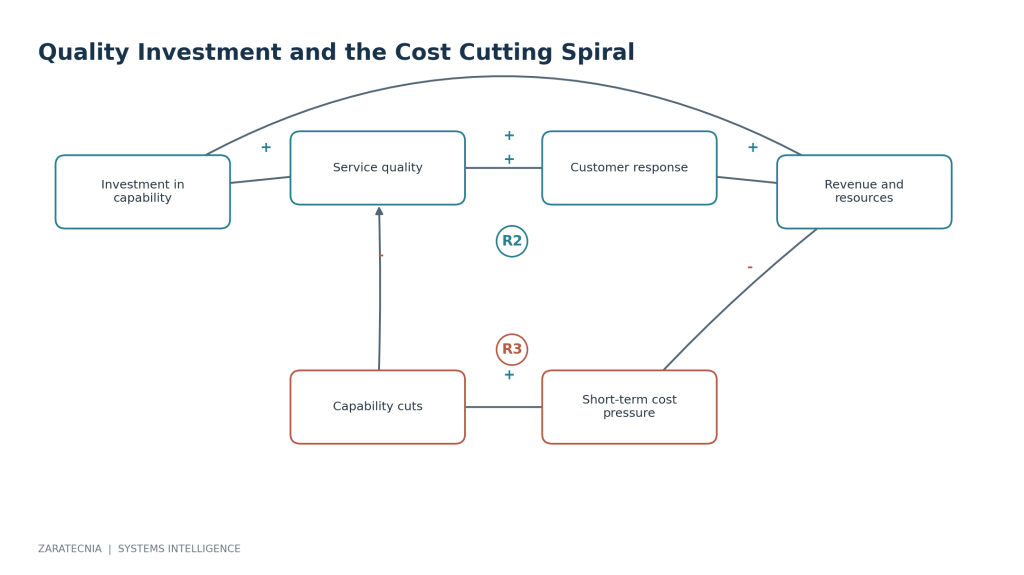
R2 represents capability-led growth; R3 represents a cost-cutting decline.
This does not imply that all cost reduction is harmful. Waste, duplication and unnecessary complexity should be removed. The systemic issue is where the cost resides and what feedback it supports. Eliminating failure demand, rework or obsolete activity differs fundamentally from removing the capability that prevents defects or creates customer value.
A robust cost decision should evaluate at least four horizons: the immediate accounting effect, the operational response, the customer response and the capability effect. It should also distinguish reversible from difficult-to-reverse consequences. A reduction in discretionary expenditure can be restored relatively quickly; the loss of experienced employees, trust, knowledge or market reputation may take years to reverse.
Growth contains its own constraints
Reinforcing loops are the engines of growth. A larger customer base generates more referrals; referrals attract new customers; the customer base expands further. Higher revenue supports investment; investment strengthens the offer; the improved offer produces additional revenue. Exponential growth, however, cannot continue indefinitely. A balancing process eventually becomes dominant.
Capacity is a common constraint. Demand grows faster than staffing, systems, infrastructure or managerial attention. Service quality declines, delivery time increases and customer acquisition or retention weakens. Leaders who observe only the growth engine may respond by increasing promotion, thereby placing additional pressure on the actual constraint.
Figure 3. Growth and the capacity constraint
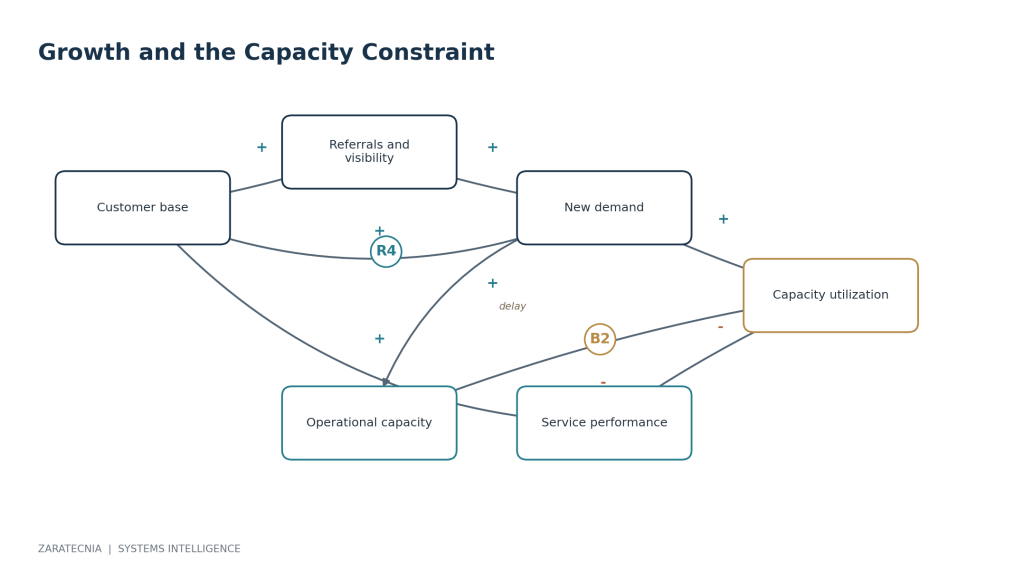
Synthesis of reinforcing and balancing structures and the limits-to-growth logic.
The strategic task is not to suppress growth, but to identify the limiting process early enough to expand or redesign it. That requires leading indicators. If customer complaints are the first recognized signal of insufficient capacity, the intervention is already late. Capacity utilization, queue length, response time, span of control, system availability and training pipeline may reveal the constraint earlier.
The same logic applies in tourism and aviation. Promotion can stimulate bookings, but airport capacity, air connectivity, hotel inventory, destination mobility, workforce availability or community tolerance may become limiting factors. More marketing does not resolve those constraints. It can worsen congestion and diminish the visitor and resident experience. A systemic strategy aligns demand generation with the capacity and resilience of the destination.
Targets, balancing loops and oscillation
Much of management operates through balancing loops. Leaders set a target, compare it with actual performance, identify a gap and act to close it. Budgets, staffing plans, inventory policies, service standards and sales objectives all contain this basic structure.
Figure 4. Capacity adjustment with delay
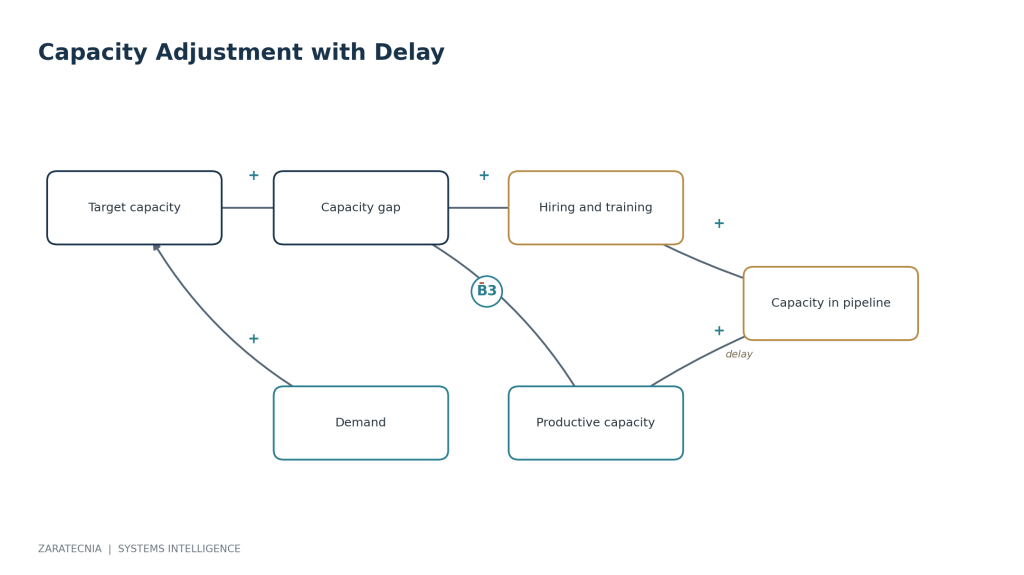
Synthesis of target adjustment and implementation delays.
Balancing does not guarantee stability. When information or implementation is delayed, managers may continue acting after sufficient correction is already in progress. The result is overshoot. They subsequently reverse direction, again too strongly, producing cycles of expansion and contraction.
Hiring illustrates this behavior. A service gap creates pressure to recruit. Recruitment, onboarding and learning take time. During the delay, the perceived gap persists, so additional hiring is authorized. When new employees finally become productive, capacity exceeds demand and a cost reduction follows. The organization alternates between understaffing and overstaffing, treating each phase as a new problem instead of recognizing a common delayed feedback structure.
Better policy begins with distinguishing the observed stock from actions already in the pipeline. Managers need visibility not only into current productive capacity but also into candidates being recruited, employees in training, expected attrition and productivity maturation. The target should incorporate demand uncertainty and the cost of both excess capacity and service failure.
Leadership and shared mental models
Complex systems cannot be understood from a single position. Sales sees customer opportunity, operations sees variability, finance sees resource exposure and employees see the actual workarounds that keep processes functioning. Each perspective is incomplete but potentially valid.
Mental models are the assumptions, beliefs and causal interpretations used to make decisions. They are unavoidable; the problem is that they are often implicit, internally inconsistent and resistant to disconfirming evidence. Group modeling makes these assumptions visible. Participants must name variables, specify causal direction, define the system boundary and explain why they expect a link to operate.
Cases involving teamwork, leadership and outsourcing demonstrate that conflict can emerge from structurally rational behavior. A buyer interferes because contractor performance appears inadequate. Intervention reduces the contractor’s autonomy and accountability, which further weakens performance and invites more interference. From the buyer’s perspective, tighter control is necessary; from the contractor’s perspective, that control is the source of dysfunction. The causal map reveals how both interpretations can coexist within one reinforcing loop.
Leadership in this setting is not the ability to impose the fastest answer. It is the ability to establish a process in which competing models can be examined without collapsing into blame. A strong modeling team includes decision owners, process experts, data owners and people close to implementation. Its purpose is not consensus for its own sake. It is a sufficiently explicit, evidence-informed theory of the system that can be challenged and improved.
From maps to evidence and simulation
A productive systems engagement should proceed through disciplined stages.
The first is problem articulation. The team defines a reference mode: the pattern of behavior that requires explanation. Is productivity declining continuously, oscillating, recovering only temporarily, or diverging across units? A time-series graph is often more informative than a static average.
The second is boundary selection. No model includes everything. The boundary should contain the variables and feedback processes necessary to explain the behavior and evaluate relevant decisions. Boundaries that follow the organizational chart are often inadequate because important feedback crosses departments and external actors.
The third is causal mapping. The team identifies reinforcing and balancing loops, delays, constraints and possible unintended consequences. Every link should form a clear, testable statement. Ambiguous variables such as “success” or “better management” should be replaced by quantities or conditions that can be observed or operationally defined.
The fourth is empirical assessment. Historical data, interviews, process records and external evidence are used to challenge the map. Statistical techniques may estimate response strength, detect lags, compare segments or reject assumptions. Qualitative evidence remains important when variables such as trust, perceived autonomy or decision quality cannot be measured directly with sufficient reliability.
The fifth is formalization when the decision warrants it. Stocks, flows, equations and decision rules convert the map into a simulation. The model should be tested for dimensional consistency, extreme conditions, behavioral reproduction and sensitivity. Validation is not a declaration that the model is “true.” It is a cumulative argument that the model is suitable for its stated purpose.
The sixth is policy design. Leaders compare packages of interventions, not isolated adjustments. A hiring policy may be combined with workflow redesign, demand smoothing and quality controls. The relevant criteria include performance across time, robustness under uncertainty, distribution of effects, implementation feasibility and exposure to irreversible loss.
This logic can be extended to risky projects by combining the capacity of system dynamics to represent nonlinear feedback and delay with decision trees that represent managerial flexibility. The strategic principle is important: the value of a project depends not only on expected cash flow but also on the ability to expand, postpone, alter or terminate action as information emerges. A fixed plan and an adaptive policy are not economically equivalent.
Measuring a productive system
Measurement must follow the causal theory rather than precede it. Organizations often select indicators because data are available, then treat the resulting dashboard as a representation of the business. A systemic approach begins with the behavior that requires explanation and identifies the minimum set of measures needed to observe its proposed drivers and consequences.
Indicators should cover outcomes, leading conditions and accumulations. Revenue, margin, customer satisfaction and throughput describe outcomes. Workload pressure, queue growth, schedule adherence, training progression and error incidence can warn that future performance is changing. Stocks such as experienced employees, unresolved cases, installed capacity, active customers and organizational knowledge preserve the effects of past decisions and constrain future possibilities.
The timing of measurement is equally important. A monthly average may hide a weekly cycle of overload and recovery. A year-over-year comparison may combine several periods governed by different dominant loops. Analysts should examine trajectories, lags, thresholds and changes in variability, not only levels. When an intervention is introduced, its immediate, transitional and steady-state effects should be evaluated separately.
No single productivity index can capture this structure. A compact measurement architecture is more useful: a primary performance outcome, a small number of leading indicators, explicit measures of failure demand and capability, and decision triggers linked to the model. This creates a learning loop in which data update the causal theory, the theory guides policy and policy outcomes generate new evidence. The purpose of measurement is therefore not merely control. It is continuous correction of the organization’s understanding of how performance is produced.
High leverage does not mean high force
Organizations frequently direct effort toward visible symptoms because symptoms create urgency and can be measured immediately. High-leverage interventions are often less visible. They may change an information flow, a decision rule, a delay, a target, an incentive or the capacity of the organization to learn.
In the rework trap, demanding additional effort applies more force to the existing system. Reducing error creation, simplifying exceptions, improving upstream information or protecting recovery time changes the structure. In the growth system, a larger promotional budget accelerates the reinforcing loop; developing operational capacity or moderating demand until capacity matures addresses the constraint. In an outsourcing conflict, more supervision may intensify dependence; clearer decision rights and shared performance information can alter the feedback.
Leverage must also be evaluated in context. An intervention that works while demand is stable may fail during rapid growth. A policy effective in one business unit may encounter different delays or constraints elsewhere. The objective is not to discover a universal lever, but to design a policy robust across plausible conditions.
A practical method for systemic problem solving
A systems inquiry begins by defining the behavior that needs explanation, not by selecting a fashionable tool. The team describes how the problem has changed over time, identifies who experiences its consequences and establishes a decision horizon. This prevents a visible event from being mistaken for the problem itself and creates a reference pattern against which explanations can be tested.
The next step is to bring together people who see different parts of the system and build a causal map of feedback loops, delays, constraints and important accumulations. The map should expose assumptions and disagreements rather than conceal them. Historical data, interviews and process evidence can then be used to challenge the proposed relationships. Where the decision is consequential and the dynamics are complex, the map can be formalized as a simulation to compare policies across time and under uncertainty.
Data science and artificial intelligence strengthen this work when they are assigned a clear role. They can detect patterns, estimate relationships, organize evidence, automate repeated analysis and support scenario exploration. They do not eliminate the need to define the system boundary, select relevant variables or judge whether an intervention remains sensible after people and processes respond. The quality of an AI-assisted answer still depends on the quality of the question and the causal structure used to interpret the result.
Conclusion
Productivity is not produced by pressure alone. It emerges from a network of decisions and conditions that includes workload, capacity, quality, learning, technology, customer response, investment and time. When these relationships form feedback loops, apparently sensible decisions can generate resistance, delay, oscillation or decline.
Systems thinking gives leaders a language for seeing those relationships. Causal-loop diagrams organize hypotheses about reinforcing and balancing processes. System dynamics adds accumulations, equations and simulation, allowing teams to explore how policies may perform over time. Data analysis tests assumptions and anchors the model in observed behavior. Together, these approaches transform productivity management from isolated optimization into structural design.
The practical implication is direct: before asking people to work harder or departments to optimize their own indicators, leaders should examine the system that defines what productive effort can achieve. The best intervention may not be the largest, fastest or most visible. It is the one that changes the feedback structure generating the problem and continues to work after the organization responds.
References
Forrester, J. W. (1961). Industrial dynamics. MIT Press.
Lyneis, J. M., & Ford, D. N. (2007). System dynamics applied to project management: A survey, assessment, and directions for future research. System Dynamics Review, 23(2-3), 157-189. https://doi.org/10.1002/sdr.377
Sherwood, D. (2002). Seeing the forest for the trees: A manager’s guide to applying systems thinking. Nicholas Brealey Publishing.
Sterman, J. D. (2000). Business dynamics: Systems thinking and modeling for a complex world. Irwin/McGraw-Hill.
Tan, B., Anderson, E. G., Jr., Dyer, J. S., & Parker, G. G. (2010). Evaluating system dynamics models of risky projects using decision trees: Alternative energy projects as an illustrative example. System Dynamics Review, 26(1), 1-17. https://doi.org/10.1002/sdr.433

