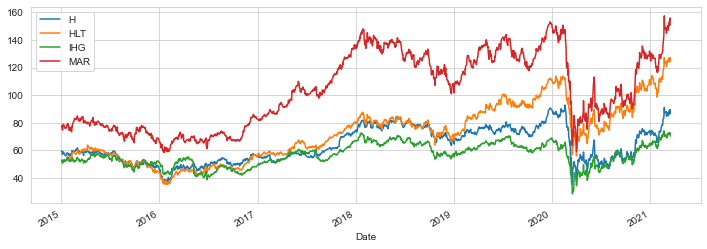
Exactly a year ago was that official announcements unveiling we were amid a Covid19 pandemic and stock markets were heavily hit. In the hotel industry specifically, the largest brands reached their minimum returns since 2015. Marriott -15%, Hilton -12%, Hyatt -19% , and IHG -20%.
But fortunately for the top hotel chains and their strong position to tackle COVID-19, the stock market recovery was pretty fast considering the magnitude of an unprecedented event moving back to levels of Hilton’s 14% to Marriott’s 20% positive return range, from ending March to beginning April last year.
Now, the behavior of their stocks today 2021-3-18 looks normal for the four chains observed, although it shows a slight decline for every chain.
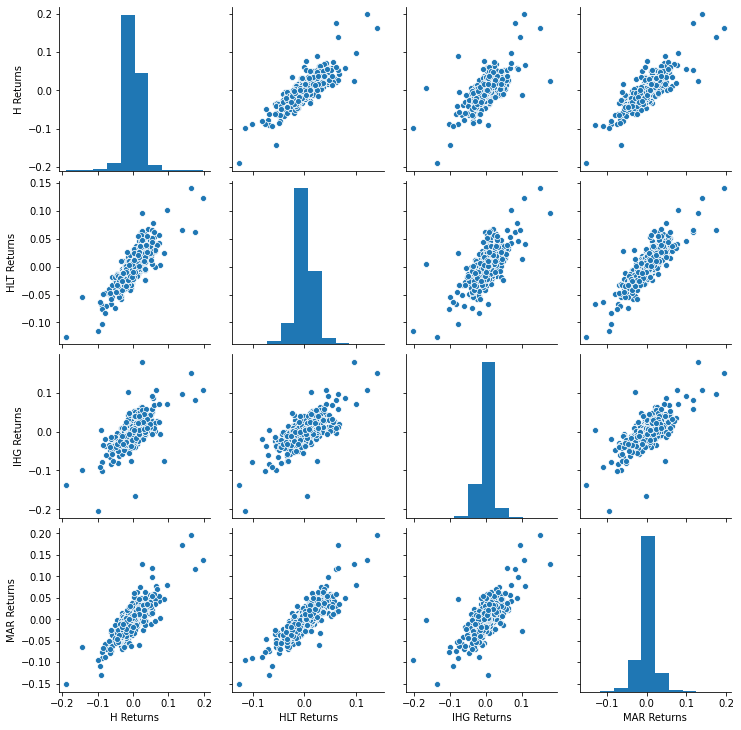
In the following plot, we can see there is a strong returns correlation between each other.
Strategic Management for Travel and Tourism Leaders
Introduction: A Lifelong Journey Informed by Strategy
After thirty-five years devoted to the vibrant, challenging, and ever-evolving travel and tourism industry, I have witnessed booms, busts, disruptions, and transformations. From the dawn of the internet to the recent global pandemic, I have learned that success in this sector is not merely a product of passion or luck, but the result of deliberate, insightful, and well-executed strategy. It is with this hard-earned perspective that I have turned to one of the most respected texts in the field of business strategy, Strategic Management: Competitiveness and Globalization, Concepts and Cases by Hitt, Ireland, and Hoskisson. My purpose is clear: to analyze and translate their comprehensive strategic management process into a practical playbook for my peers and successors in travel and tourism.
This article is the culmination of that effort. It moves beyond academic theory to provide a actionable framework for travel agents, tour operators, hoteliers, destination managers, and all tourism professionals. The volatile and interconnected nature of our global industry demands a disciplined approach to navigate competition, leverage globalization, and secure lasting success. By applying the integrated model from Hitt et al. (2021) to the specific contexts we face daily, we can move from being reactive participants to proactive, strategic architects of our own destinies. Consider this a manual,a guide built on proven strategic principles and decades of industry experience,designed to equip you with the tools not just to survive, but to thrive and become a successful agent of change in the world of travel.
The Integrated Strategic Management Process: A Blueprint for Tourism
Hitt et al. (2021) present strategic management as an integrated, ongoing process rather than a series of disconnected exercises. This process model, which flows from analysis to action to outcomes, is perfectly suited to the interconnected nature of tourism. The model begins with a rigorous analysis of strategic inputs, leading to the formulation and implementation of strategic actions, all with the goal of achieving strategic outcomes,primarily, strategic competitiveness and above-average returns.
Part 1: Strategic Inputs – Analyzing the Terrain
The first phase involves a clear-eyed assessment of the internal and external environments, a foundational step for any tourism enterprise.
External Analysis
A comprehensive external analysis examines the general, industry, and competitor environments. The general environment, often analyzed through a PESTEL (Political, Economic, Socio-cultural, Technological, Environmental, Legal) framework, is particularly volatile for tourism.
Political & Economic: Visa regulations, geopolitical stability, and trade policies can open or close markets overnight. Economic factors like inflation, exchange rates, and disposable income directly dictate travel propensity. A tour operator specializing in luxury travel to Europe, for instance, must constantly monitor currency fluctuations and economic forecasts in key source markets like North America and Asia.
Socio-cultural: The rise of the “experience economy,” where consumers value unique, authentic, and Instagram-worthy moments over material goods, is a dominant trend (Pine & Gilmore, 1999). There is also a growing demand for transformative travel, where the goal is personal growth and cultural immersion. Furthermore, the increasing awareness of overtourism is pushing destinations and companies to consider more responsible models.
Technological: This is a primary disruptive force. The ascendancy of Airbnb disrupted the hotel industry, while Google Travel and Booking.com consolidated immense power in the distribution channel. Emerging technologies like Artificial Intelligence (AI) for personalized travel planning, the Internet of Things (IoT) for smart hotel rooms, and virtual reality for destination previews are reshaping the customer journey from inspiration to post-trip sharing.
Environmental: Climate change is a dual-edged sword. It poses a physical threat to low-lying coastal resorts and ski destinations, while simultaneously driving demand for sustainable and low-impact travel options. The flight-shaming movement and consumer preference for businesses with strong environmental, social, and governance (ESG) credentials are becoming significant factors.
The heart of external analysis is the industry environment, best understood through Michael Porter’s Five Forces model (Porter, 1980).
Threat of New Entrants: Barriers to entry can be low for online travel agencies (OTAs) or small tour guides, but are exceptionally high for airlines or large cruise lines due to capital requirements and regulation.
Bargaining Power of Buyers: The power of individual travelers has never been greater, thanks to price-comparison websites and social media reviews. Large corporate travel departments also wield significant power in negotiating rates.
Bargaining Power of Suppliers: This is high for key assets. Airlines are dependent on aircraft manufacturers (Boeing, Airbus) and constrained by limited airport slots. Hotels are at the mercy of global distribution systems (GDS) and OTAs for customer acquisition.
Threat of Substitute Products: Videoconferencing is a substitute for business travel. A “staycation” or a local experiential purchase can substitute for a distant vacation.
Rivalry Among Existing Competitors: Fierce, often based on price, as seen in the constant price wars between airlines and OTAs.
Internal Analysis
While the external environment presents opportunities and threats, the internal environment reveals a firm’s strengths and weaknesses. The Resource-Based View (RBV) of the firm, a central concept in Hitt et al. (2021), argues that competitive advantage stems from possessing valuable, rare, inimitable, and non-substitutable (VRIN) resources and capabilities.
For a tourism company, these can be tangible, such as a fleet of new, fuel-efficient aircraft or a prime beachfront property. However, sustainable advantage more often lies in intangible resources:
Human Capital: A highly trained, empathetic staff that delivers exceptional service can be a powerful differentiator for a hotel chain or a tour company.
Brand Reputation: Brands like Four Seasons or Abercrombie & Kent have built reputations for quality and exclusivity that are difficult for competitors to replicate.
Intellectual Property: Proprietary booking algorithms, unique itineraries, or patented technology.
Organizational Culture: A culture of innovation and agility, as seen in companies like Airbnb, which allows them to pivot and adapt quickly to market changes.
A SWOT analysis (Strengths, Weaknesses, Opportunities, Threats) is a useful tool to synthesize the findings from the internal and external analyses, creating a clear strategic picture.
Part 2: Strategic Actions – Formulating and Executing the Plan
With a clear understanding of the strategic inputs, a firm can formulate its strategic actions.
Business-Level Strategy
This concerns how a firm competes in a specific market or industry segment. Hitt et al. (2021) outline the generic strategies of cost leadership, differentiation, and focus.
Cost Leadership: This strategy involves being the low-cost producer in the industry. Ryanair and EasyJet are quintessential examples in the airline sector. They achieve this through a no-frills service model, standardized fleets, and aggressive cost control on everything from airport fees to staff costs. In tourism, large OTAs like Booking.com also compete on cost (or rather, price) by offering the broadest inventory and leveraging scale to secure competitive rates.
Differentiation: This strategy involves creating a product or service that is perceived as unique industry-wide. The Ritz-Carlton Hotel Company differentiates itself through its legendary service and “Gold Standards.” Intrepid Travel differentiates by offering small-group, sustainable, and culturally immersive adventures that are distinct from mass-market tours. Differentiation allows a company to command a premium price.
Integrated Cost Leadership/Differentiation: This hybrid approach, increasingly common, is enabled by technology. For instance, Virgin Atlantic attempts to offer some differentiated, stylish amenities while maintaining a competitive cost structure on its routes.
Use Case 1: “EcoLodge Andes” – Differentiation through Sustainability
Imagine “EcoLodge Andes,” a small hotel in Peru. Its external analysis reveals a strong opportunity in the growing market for sustainable travel and a threat from larger, conventional resorts. Its internal analysis identifies key strengths: a unique, remote location, deep partnerships with local communities, and authentic expertise in the local ecology (VRIN resources).
Its strategic action is a focused differentiation strategy. It targets a specific segment of travelers,affluent, environmentally conscious ecotourists. It formulates its strategy around its unique value proposition: unparalleled access to nature with a minimal environmental footprint. This is executed through:
Structure: A flat, empowered organizational structure where local guides are key decision-makers.
Controls: Rigid environmental controls (e.g., zero single-use plastic, closed-loop water systems) monitored and reported transparently.
Strategic Leadership: A leader who is both a savvy businessperson and a genuine conservation advocate, ensuring the strategy is authentically embedded in the culture.
By doing so, EcoLodge Andes avoids direct price competition with large resorts and builds a loyal customer base willing to pay a premium for its unique, values-aligned experience.
Corporate-Level Strategy
This concerns the question, “What businesses should we be in?” For diversified tourism conglomerates, this involves decisions about portfolio management.
Related Diversification: Creating value through economies of scope and sharing activities across business units. The TUI Group is a prime example. It owns airlines, hotels, cruise ships, and tour operators. This vertical and horizontal integration allows TUI to control the entire customer experience, capture revenue at multiple points, and cross-sell services, creating synergies that a standalone company cannot easily match.
Unrelated Diversification: This involves operating businesses that are not related, creating value primarily through financial economies. This is less common in pure tourism but could involve a hotel chain owning an unrelated real estate development arm.
International Strategy
Given its inherently global nature, the choice of international strategy is critical for tourism firms. Hitt et al. (2021) discuss the balance between global integration and local responsiveness.
Global Standardization: Seeking cost reduction through standardized operations worldwide. Marriott International employs this to a large degree, ensuring a consistent level of quality and service across its global portfolio, which creates efficiency and builds brand trust.
Multi-domestic Strategy: Emphasizing customization to fit local markets. A smaller tour company might use this strategy, tailoring its offerings in Japan (e.g., more group-oriented, meticulous itineraries) versus those in Australia (e.g., more independent, adventure-focused).
Transnational Strategy: The ideal, but difficult-to-achieve balance of global efficiency and local responsiveness. Airbnb attempts this: it has a globally standardized platform and brand, but its offerings are hyper-local (unique homes and experiences) and it must navigate vastly different local regulations in each market.
Use Case 2: “GlobalAir” – Navigating the Turbulence of International Strategy
“GlobalAir,” a hypothetical full-service carrier, faces intense pressure from Gulf carriers (global cost leaders) and regional low-cost carriers. Its external analysis shows high supplier power (aircraft manufacturers) and intense rivalry. Internally, its strengths are a strong brand and a valuable portfolio of landing slots at a major hub airport.
Its strategic action involves a multi-domestic partnership strategy. Recognizing it cannot compete globally on cost alone, it forgoes a pure global standardization model. Instead, it joins a global airline alliance (e.g., Star Alliance) to gain global reach and feed traffic through its hub. Simultaneously, it forms deep codeshare and joint venture partnerships with key airlines in specific geographic markets (e.g., a partner in Asia, another in South America). This allows GlobalAir to offer seamless global networks (achieving some global integration) while allowing its partners to handle local marketing, sales, and customer service, ensuring local responsiveness. This collaborative approach, leveraging strategic alliances, is a key tool for competing in the capital-intensive airline industry.
Part 3: Strategic Outcomes and the Critical Role of Implementation
Formulating a brilliant strategy is futile without effective implementation. This involves the nuts and bolts of organizational structure, controls, and strategic leadership.
Organizational Structure: A rigid, hierarchical structure will stifle the innovation required in today’s tourism market. Companies are moving toward flatter, more organic structures that empower frontline employees,the hotel concierge, the flight attendant,to solve customer problems creatively. For a large conglomerate like TUI, a multidivisional structure is necessary to manage its diverse portfolio.
Controls: Strategic controls are subjective and concerned with the long-term effectiveness of the strategy (e.g., is our brand perception improving?). Financial controls are objective and focus on short-term performance (e.g., revenue per available room). A balanced scorecard that includes both financial metrics and non-financial indicators like customer satisfaction, employee engagement, and environmental impact is essential.
Strategic Leadership: The leaders of tourism firms must be visionaries who can navigate complexity and foster an entrepreneurial culture. They are responsible for making the critical resource allocation decisions,should we invest in a new AI platform or renovate our flagship hotel? They must also manage the firm’s portfolio of resources and build an effective organizational culture. The success of companies like Airbnb can be directly attributed to the strategic leadership of its founders, who envisioned and executed a disruptive new model for travel accommodation.
Use Case 3: “Heritage City Tourism Board” – Implementing a Destination Management Strategy
A city known for its UNESCO World Heritage site faces the strategic outcome of overtourism: declining resident quality of life, damage to monuments, and a poor visitor experience,a clear failure to achieve sustainable competitiveness. The strategic input analysis reveals the threat is existential.
The city’s strategic action is to implement a comprehensive destination management strategy. The formulation involves policies like visitor caps, timed ticketing, and promoting off-season travel. However, the implementation is the true challenge.
Structure: A new public-private governance structure is created, bringing together hotels, tour operators, transport companies, and resident associations.
Controls: New strategic controls are implemented, shifting the key performance indicator from pure visitor numbers to metrics like average visitor expenditure, dispersal to lesser-visited neighborhoods, and resident satisfaction scores.
Strategic Leadership: The mayor and tourism board CEO provide the leadership to build consensus among often conflicting stakeholders (hoteliers wanting more tourists vs. residents wanting fewer). They must communicate the long-term vision of a sustainable, high-quality destination, even if it involves short-term pain.
The strategic outcome, achieved through diligent implementation, is the transition from a volume-based to a value-based tourism model, ensuring the city’s cultural and economic longevity.
Conclusion: Your Strategic Playbook for the Future
The travel and tourism industry stands at a critical juncture. The forces of globalization, technological disruption, and environmental change are not temporary disruptions but permanent features of the landscape. In this environment, the integrated strategic management process championed by Hitt, Ireland, and Hoskisson provides an indispensable roadmap for success. It demands that managers move beyond reactive tactics and embrace a disciplined cycle of analysis, formulation, and execution. From the boutique EcoLodge crafting a focused differentiation strategy to the global airline navigating complex international alliances, the principles remain the same: understand your environment, leverage your unique resources, and build an organization capable of turning strategy into reality.
This is the core of the playbook. Use it to conduct your own rigorous analysis. Use it to choose a clear competitive position rather than getting stuck in the middle. Use it to forge strategic alliances that amplify your reach. Most importantly, use it to lead with vision and execute with precision. For those who master this process, the reward is not merely survival, but the ability to thrive and shape the future of travel, achieving strategic competitiveness that is both profitable and sustainable. Let this manual be your guide as you write your own success story in the next chapter of our incredible industry.
References
Hitt, M. A., Ireland, R. D., & Hoskisson, R. E. (2021). Strategic management: Competitiveness and globalization: Concepts and cases (13th ed.). Cengage Learning.
Pine, B. J., & Gilmore, J. H. (1999). The experience economy: Work is theatre & every business a stage. Harvard Business School Press.
Porter, M. E. (1980). Competitive strategy: Techniques for analyzing industries and competitors. Free Press.
Introduction: Why Customer Analytics Matters in Travel and Tourism
In the dynamic and competitive landscape of global travel, tourism boards, destination marketing organizations (DMOs), and travel-trade teams are perpetually tasked with a critical, dual-pronged mission: to grow both visitor volume and visitor value while demonstrating fiscal prudence and maximizing return on investment. For decades, strategic decisions in this sector were often guided by intuition, historical precedent, and fragmented market research. Today, however, this approach is no longer sufficient. The digital transformation of the travel industry has generated a torrent of data, turning every booking, website click, and visitor inquiry into a potential strategic insight. The organizations that will thrive are those that can effectively harness this data to make smarter, faster, and more precise decisions.
The common misconception is that leveraging this data requires a team of PhD data scientists and a prohibitively expensive technology stack. This guide dismantles that myth. The strategic pressure to perform is real, but so is the advantage afforded by modern, accessible analytics tools. By adopting a simple, repeatable workflow supported by user-friendly Python libraries, tourism professionals can transform their routine booking and visitation data into a powerful source of practical direction. This process answers the most pressing commercial questions: Which source markets offer the greatest potential for growth? What specific offers will resonate with which audience? Which hotel partners should be featured in a campaign to maximize room nights? And what is the optimal timing for launching marketing initiatives?
This essay provides a comprehensive, end-to-end walkthrough of a customer-analytics pipeline, built specifically for the travel trade using the metrics that are already the lingua franca of the industry: core performance indicators like Room Nights, Number of Visitors, and Average Daily Rate (ADR), complemented by behavioral levers such as Lead Time, Repeat Rate, Mobile Share, and Promotion Share. The approach is deliberately non-technical, focusing on the “so what” behind each analytical step and directly linking the outputs to tangible, everyday decisions. While the examples will utilize a fictional dataset for clarity, the methodologies are directly transferable to any organization’s own data, typically exported as a CSV file.
We will progress through a logical sequence, starting with the foundational step of organizing your data for analysis. From there, we will explore segmentation techniques,Hierarchical Clustering and K-Means Clustering,to group similar customer segments, and Principal Components Analysis (PCA) to visualize these segments. The journey then advances into predictive modeling, covering models for Purchase Incidence, Brand Choice, and Purchase Quantity, before culminating with an introduction to Deep Learning for conversion prediction. The ultimate goal is to equip you with a practical, actionable blueprint,a playbook that can be handed to your team or partner agencies to operationalize data-driven decision-making, proving conclusively that you do not need a doctorate to deploy sophisticated analytics that drive growth.
1) Segmentation Data: What to Use and Why
The first and most critical step in any analytics pipeline is to properly structure your data. The goal here is to define a compact, consistent set of features that describe each “unit” you wish to compare and analyze. In the context of tourism, a highly useful unit is the Destination × Source Market pair. For instance, “Oregon Coast from Mexico” or “Interlaken from the UK” each represent a unique strategic entity. For each of these pairs, you will summarize behavioral data over a defined period, such as calculating monthly averages from January to September 2025.
The features you select should paint a holistic picture of both performance and behavior. They can be categorized into two groups:
Core Performance Indicators:
Room Nights: This is your fundamental volume anchor. It quantifies the total consumption of accommodation, directly answering the question of “how much business is materializing?”
Number of Visitors: This metric acts as a proxy for market reach or typical party size. It is often correlated with room nights but provides a distinct perspective on the number of individuals engaging with the destination.
ADR (Average Daily Rate): As a primary value anchor, ADR signals your destination’s or partners’ quality and price positioning. A high ADR suggests a premium offering, while a lower one may indicate a value-orientated or budget-friendly segment.
Behavioral and Contextual Signals:
Average Length of Stay (AvgLOS): This is a crucial yield indicator. Travelers who stay longer often contribute more to the local economy per trip and can influence seasonality planning and activity packaging.
Lead Time (days): The average number of days between booking and arrival is a powerful behavioral segmenter. Early planners respond to inspirational content and early-bird offers, while last-minute bookers are driven by urgency and instant deals.
Repeat Rate: The share of bookings from returning travelers is a direct measure of loyalty and satisfaction. This metric is invaluable for designing retention campaigns and crafting communications that reactivate past visitors.
Mobile Share: This indicates the channel preference of a market. A high mobile share necessitates a mobile-first strategy, influencing website user experience (UX), ad formats (e.g., Instagram Stories), and even the timing of digital bids to capture on-the-go planners.
Promotion Share: The portion of bookings involving a discount or special incentive helps measure price sensitivity and campaign effectiveness. Understanding this allows for smarter promotion planning and avoids discounting segments that are willing to pay full price.
The Practical Step: Using Python’s pandas library, you would load your raw CSV data, group it by Destination and Source Market, and compute the mean (or median) for each of these features. A crucial preparatory step before any modeling is standardization, achieved with a tool like StandardScaler. This process adjusts all features to a common scale, ensuring that a high-magnitude metric like Room Nights (e.g., in the thousands) does not disproportionately dominate the analysis compared to a lower-magnitude metric like Repeat Rate (e.g., a decimal between 0 and 1). This is essential data housekeeping that ensures the reliability and fairness of all subsequent analyses.
Use-case takeaway: A clean, well-constructed feature table is the bedrock of your entire analytics endeavor. It allows for the consistent comparison of different destination-market pairs and powers all downstream activities, from clustering to predictive modeling.
2) Hierarchical Clustering: Who Looks Alike (and Why That Matters)
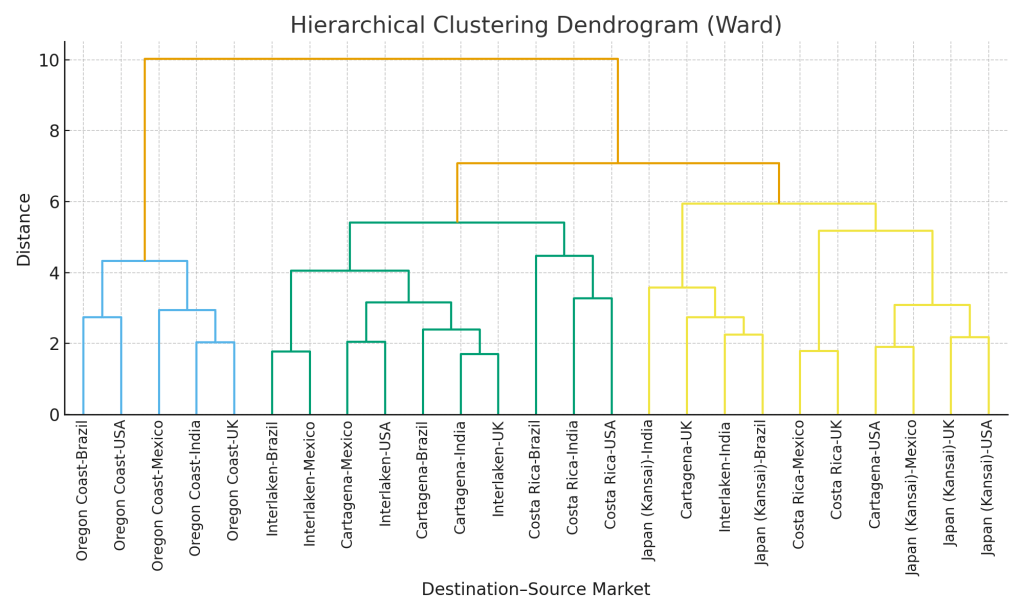
With your data standardized, the first analytical technique to apply is Hierarchical Clustering. Its primary goal is to visually discover the natural, inherent groupings within your portfolio of destination-market pairs. This method works in a “bottom-up” fashion, starting by treating each pair as its own cluster and then iteratively merging the most similar pairs into branches, and those branches into larger groups. The output is a tree-like diagram called a dendrogram.
The significant advantage of this approach is that you are not forced to pre-define the number of clusters. Instead, you can observe the entire hierarchy and “cut” the dendrogram at a level that provides a useful granularity for your business strategy.
What you get: A dendrogram provides an intuitive visual map of similarity. If the pair “Mexico → Costa Rica” sits right next to “Brazil → Costa Rica” on the tree, it indicates that these two source markets exhibit highly similar behavior when traveling to that particular destination, sharing common traits in ADR, lead times, mobile usage, and other features.
How to use it:
Campaign Bundling: This is a primary application. You can roll out standardized training webinars, travel-trade toolkits, or co-operative marketing offers to all destination-market pairs that reside within the same branch of the tree, ensuring resource efficiency and message consistency.
Tailored Strategies for Outliers: The dendrogram makes it easy to identify pairs that are clear outliers, not merging with any other group until the very end. These unique segments likely require highly dedicated messaging, custom product development, or further investigation to understand their distinct drivers.
Practical step: Using scipy.cluster.hierarchy.linkage (with the ‘ward’ method to minimize variance within clusters) and the dendrogram function, you can generate this tree from your standardized feature set. Begin by visually inspecting the dendrogram to identify where large vertical spaces indicate natural divisions, typically suggesting 3 to 5 primary clusters, and adjust based on your strategic need for granularity.
3) K-Means Clustering: Fast, Practical Grouping You Can Operationalize
While Hierarchical Clustering is excellent for exploration, K-Means Clustering is often the workhorse for operationalization. Its goal is to assign every destination-market pair to one of a pre-defined number of groups (k), where the members within each group are as similar as possible and the groups themselves are as distinct as possible. The output is a clear, definitive cluster label (e.g., Cluster 0, Cluster 1, etc.) for each pair, which can be easily exported to a CRM, marketing automation platform, or dashboard.
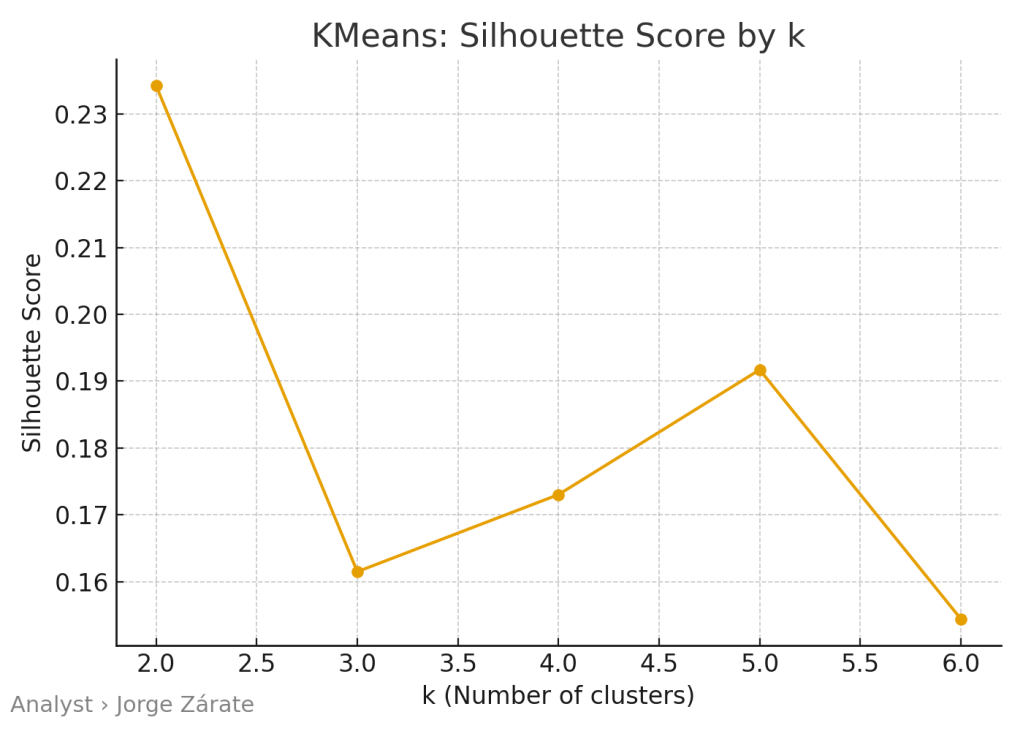
The most important decision in K-Means is selecting the right number of clusters (k). This is not a guessing game; it is guided by data-driven diagnostics:
The Elbow Method: This involves plotting the model’s inertia (a measure of internal error) against the number of clusters. The ideal ‘k’ is often found at the “elbow” of the plot,the point where adding another cluster provides only a marginal reduction in error, indicating diminishing returns.
The Silhouette Score: This metric quantifies how well each point fits within its own cluster compared to the nearest neighboring cluster. A higher average silhouette score indicates better, more coherent clustering.
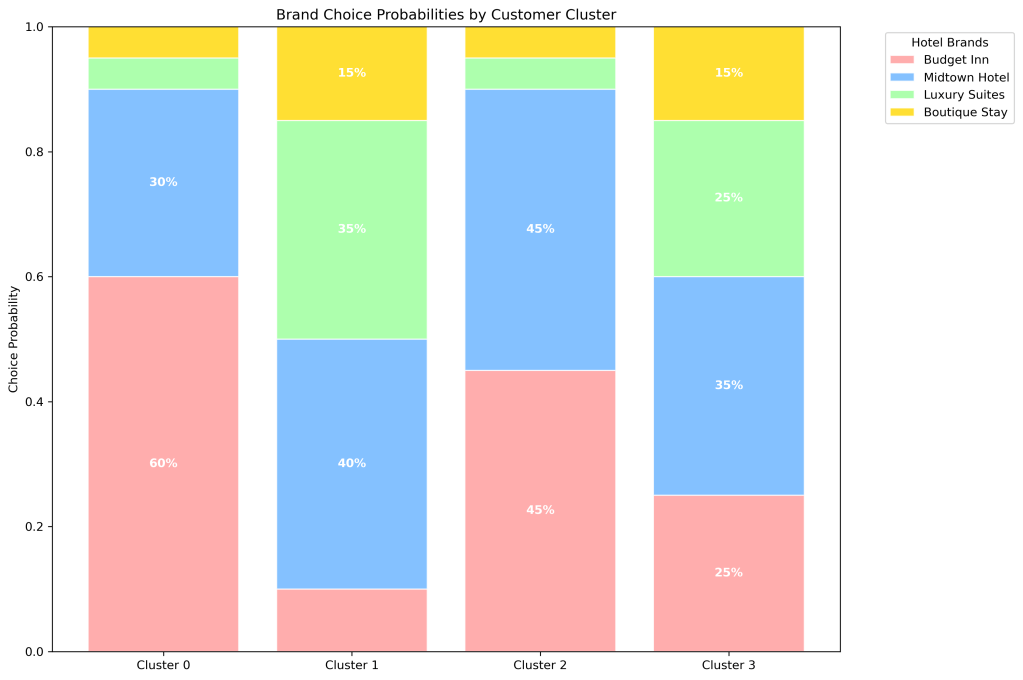
What you get: A concise, actionable segmentation. For example, your analysis might reveal four distinct clusters:
Cluster 0: The Planned Volume Drivers. High room nights, mid-range ADR, very long lead times. Strategy: Target with early-bird campaigns, focus on group and room-block planning with hotel partners.
Cluster 1: The Premium Experience Seekers. Lower volume, high ADR, short stays. Strategy: Develop luxury content, forge partnerships with high-end tour operators and boutique hotels, and craft premium-branded itineraries.
Cluster 2: The Mobile-First Deal Chasers. Mobile-heavy, highly promotion-sensitive, shorter lead times. Strategy: Push mobile-optimized promo codes, invest in last-minute deal platforms, and utilize ad formats suited for smartphone users.
Cluster 3: The Loyal Return Visitors. High repeat rate, potentially moderate ADR and room nights. Strategy: Implement loyalty communications, exclusive “welcome back” offers, and reactivation flows to keep them engaged.
Practical step: Using sklearn.cluster.KMeans (with n_clusters=k and n_init=10 for stability), you fit the model on your standardized features. The resulting cluster labels are then saved as a new column in your original dataset, ready for immediate use by marketing and sales teams.
4) PCA (Principal Components Analysis): Seeing Segments on a 2D Map
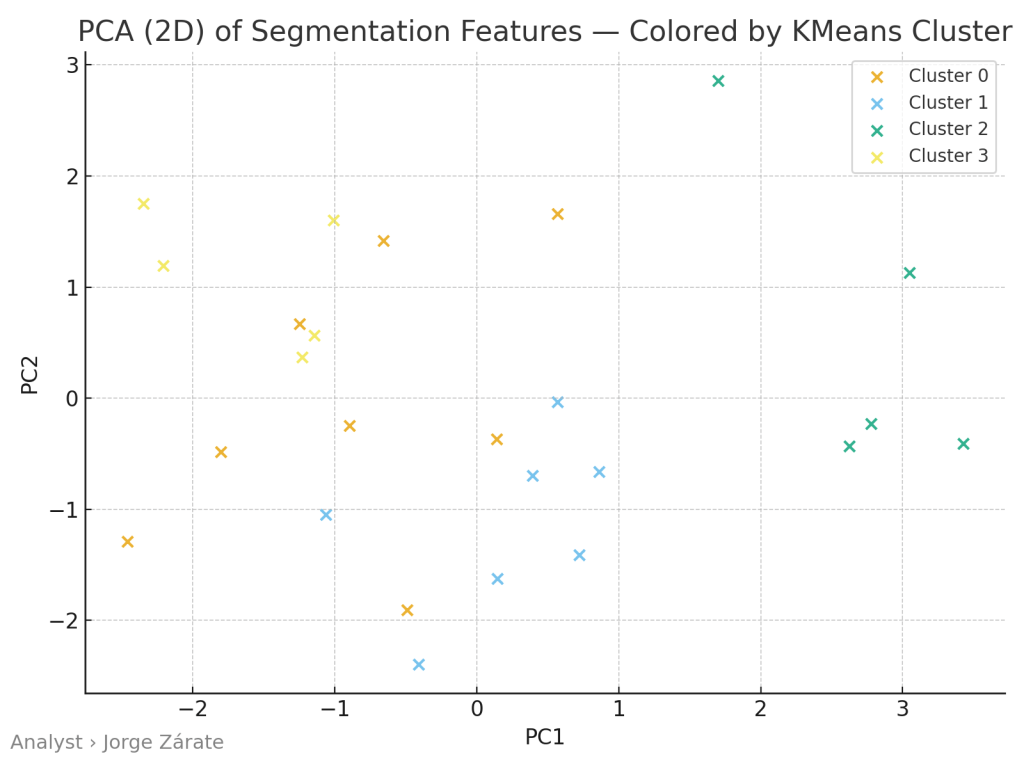
Principal Components Analysis (PCA) is not a clustering method itself but a powerful companion visualization tool. In the modern world, we often deal with many features (e.g., 7 or more), which is impossible for the human brain to visualize. PCA solves this by performing a mathematical transformation that creates new, synthetic axes,called Principal Components (PC1, PC2, etc.),that capture the maximum possible variance in the data. By plotting the data using just the first two components (PC1 and PC2), we can effectively visualize a high-dimensional dataset on a simple 2D scatter plot.
What you see: On a PCA plot, each point represents a destination-market pair. The key insight comes from observing the spatial arrangement. Points that group closely together on the 2D map are behaviorally similar and will likely belong to the same K-Means cluster. Furthermore, you can interpret the axes:
Separation along PC1 might primarily reflect a “scale” dimension, with metrics like Room Nights and Number of Visitors having the highest influence.
Separation along PC2 might reflect a “behavioral” dimension, driven by the mix of Repeat Rate, Mobile Share, Promotion Share, and Lead Time.
How to use it:
Executive Communication: A PCA plot is an invaluable tool for quickly briefing non-technical stakeholders. You can show a clear visual of why your clusters are distinct and defensible, moving the conversation from abstract statistics to tangible groupings on a map.
Cluster Validation: It allows you to spot borderline pairs that sit between two clusters, which might indicate a need to review their cluster assignment or understand their unique hybrid nature.
Practical step: Using sklearn.decomposition.PCA(n_components=2), you fit the model on your standardized features and transform them. You then create a scatter plot of PC1 vs. PC2, coloring each point based on the K-Means cluster label assigned earlier.
5) Purchase Data: What the Table Looks Like
Transitioning from segmentation to prediction requires a slightly different but equally straightforward data structure. The good news is that you do not need complex data models. A tidy, transaction-level table is sufficient to build powerful predictive models. A typical row in this table would represent a single customer’s opportunity to make a purchase (a “purchase occasion”). The columns would include:
Customer_ID: A unique identifier for the traveler or booker.
Session_ID / Trip_Context: Identifier for the booking session or planning window.
Date_Time: Timestamp of the session or search.
Destination_Market: The relevant segment the customer belongs to (often derived from the clustering exercise).
Promo_Exposed: A binary flag (0/1) indicating whether the customer was exposed to a promotion.
Channel: The platform used (e.g., Desktop, Mobile App, Mobile Web, Travel Agent).
Brand_Hotel_A, Brand_Hotel_B, …, No_Purchase: A set of columns indicating which brand or hotel was chosen. Typically, these are binary, with one column set to 1 for the chosen option and all others set to 0. A separate column or a specific code would indicate a session that did not result in a purchase.
Quantity: The number of room nights booked (0 if no purchase).
ADR_Selected: The Average Daily Rate of the chosen option.
This structure sets the stage for the next phase of the analytics pipeline: moving from understanding who your customers are to predicting what they will do next. With this data, we can build models that answer three fundamental questions for any given customer interaction: Will they book? (Purchase Incidence), If so, which property will they choose? (Brand Choice), and How many rooms or nights will they book? (Purchase Quantity). This predictive capability, culminating in advanced techniques like deep learning, allows tourism boards to move from retrospective reporting to proactive, personalized, and profoundly more effective engagement.
In conclusion, the journey from raw data to strategic insight is both accessible and actionable for modern tourism professionals. By systematically implementing this step-by-step guide,from data preparation and customer segmentation to advanced predictive modeling,tourism boards and travel-trade teams can shed the cloak of intuition-based decision-making. They can instead embrace a culture of data-driven precision, allowing them to allocate resources smarter, design campaigns that resonate deeply, and ultimately, grow visitor volume and value in an increasingly competitive global marketplace. The blueprint is here; the tools are available. The next step is to begin.
6) Descriptive Analyses: Quick Wins and Actionable Insights
Before diving into complex modeling, the most prudent starting point is often the simplest: descriptive analytics. This foundational analysis focuses on summarizing historical data to identify patterns, trends, and anomalies that can yield immediate “quick wins.” The goal is not to predict the future but to understand the past and present with crystal clarity, providing a solid evidence base for tactical adjustments.
What to Look For:
Seasonality Patterns: By plotting Room Nights or Number of Visitors by month or week, you can identify clear peaks and troughs. This isn’t just about knowing that summer is busy; it’s about understanding the precise magnitude and timing of demand surges for specific source markets. For instance, you might discover that the UK market consistently books coastal destinations 12 weeks in advance for summer travel, while the domestic market books only 3 weeks out.
Channel Performance: Compare conversion rates and ADR across channels like Desktop, Mobile Web, and Mobile App. A common finding is that while mobile traffic dominates, its conversion rate is lower than desktop. This insight immediately directs investment toward improving the mobile user experience or developing a mobile-specific strategy.
Promotion Effectiveness: Analyze the uplift in volume driven by promotions versus the potential cannibalization of full-price bookings. Calculate the net revenue impact of a promotion by comparing the promoted ADR and volume to a baseline period. You might find that certain clusters (like the “Mobile-First Deal Chasers”) are highly promotion-sensitive, while the “Premium Experience Seekers” are largely indifferent, allowing for more targeted discounting.
Source Market Comparison: A simple dashboard comparing key metrics,Room Nights, ADR, Repeat Rate,across your source markets can immediately highlight star performers and laggards, directing your business development efforts.
Practical Step: Using pandas for aggregation and a visualization library like matplotlib or seaborn, you can quickly generate:
Time series plots of key metrics.
Bar charts comparing averages across channels or markets.
Pie charts showing the share of bookings by device type.
Use-case takeaway: Descriptive analyses often provide the lowest-hanging fruit. A single afternoon of analysis can reveal that shifting 20% of a marketing budget from a low-performing channel to a high-performing one, or adjusting the timing of a campaign by two weeks to align with actual booking windows, can yield significant immediate returns. This step builds analytical confidence and creates stakeholder buy-in for more advanced modeling.
7) Modeling Purchase Incidence: Predicting the “Book vs. No-Book” Decision
The first step in predictive modeling is to tackle the most fundamental question: given a potential customer’s interaction (a website session, a brochure request, a trade show encounter), will they convert and make a booking? This is the problem of Purchase Incidence modeling. We are predicting a binary outcome: 1 for a booking, 0 for no booking.
The Model: Logistic Regression For this task, Logistic Regression is an excellent starting point. It’s relatively simple to implement and interpret, making it ideal for a non-technical audience. The model estimates the probability of a purchase based on input features. Its output is a value between 0 and 1, which can be interpreted as the likelihood of conversion.
Input Features (Independent Variables):
Source Market Cluster: The cluster label from the K-Means analysis. This is a powerful categorical variable that encapsulates a rich profile of the customer’s behavior.
Channel: The platform used by the visitor.
Promo_Exposed: Whether a promotion was shown.
Time of Year: Seasonal indicators (e.g., month, or a flag for peak/off-peak).
Number of Previous Visits: A proxy for customer loyalty.
Output (Dependent Variable): A binary flag indicating whether a booking occurred.
How to use it:
Lead Scoring: Each incoming web session or inquiry can be assigned a real-time “propensity to book” score. High-probability leads can be routed for immediate follow-up (e.g., a live chat invitation, a targeted phone call from a travel trade specialist), while low-probability sessions can be nurtured with inspirational content.
Budget Allocation: If the model reveals that visitors from “Cluster 2 (Mobile-First Deal Chasers)” have a 50% higher probability of booking when exposed to a mobile-specific promo, you can confidently allocate more budget to that specific tactic.
Website Personalization: A visitor identified as high-propensity could be shown a simplified booking path or a reassuring message about limited availability, while a low-propensity visitor might be shown more inspirational videos and testimonials.
Practical Step: Using sklearn.linear_model.LogisticRegression, you fit the model on historical “purchase occasion” data. The model’s coefficients will tell you the direction and strength of each feature’s influence. For example, a positive coefficient for “Promo_Exposed” confirms that promotions generally increase conversion probability.
Once you’ve established that a customer is likely to book, the next logical question is: which specific hotel, brand, or package will they choose? The Brand Choice model answers this. It’s a classification problem where the outcome is not binary but a category,the specific brand selected from a set of alternatives.
The Model: Multinomial Logistic Regression This model is an extension of logistic regression for scenarios with more than two possible outcomes. It predicts the probability of a customer choosing each available alternative (e.g., Hotel Brand A, B, C, or none).
Input Features: These often include both customer characteristics and attributes of the alternatives themselves.
Customer-specific: Their cluster, past loyalty to a specific brand, channel.
Alternative-specific: The ADR of each hotel, its promotional status, its aggregate rating (e.g., TripAdvisor score), and its perceived “distance” from the customer’s ideal preference.
How to use it:
Personalized Offers and Display: If the model predicts a 70% probability that a customer from “Cluster 1 (Premium Seekers)” will choose Boutique Hotel A, then that hotel’s offer and imagery can be featured most prominently in their browsing experience.
Competitive Intelligence: The model quantifies the trade-offs customers make. For example, how much does a $10 increase in ADR decrease the probability of choice? How much market share does a 0.5-point increase in a review score garner? This allows for optimized pricing and partnership strategies.
Portfolio Management: For a DMO, understanding the choice drivers between different hotel partners or regions within the destination can inform which partners to feature in international campaigns and where to invest in product development.
Practical Step: The data must be structured in a “long” format where each row represents an alternative (brand) for a given purchase occasion. Libraries like statsmodels offer robust implementations for this type of model.
9) Modeling Purchase Quantity: Predicting “How Many Rooms?”
The final piece of the purchase puzzle is quantity. For a given booking, how many room nights will be reserved? Modeling Purchase Quantity is a regression problem, as the output is a continuous number.
The Model: Poisson or Negative Binomial Regression Since the quantity of room nights is a count (non-negative integer), standard linear regression may not be ideal. Poisson Regression is designed for such count data. However, if your data is over-dispersed (the variance is much greater than the mean), which is common in travel where party sizes vary greatly, Negative Binomial Regression is a more appropriate choice.
Input Features:
Customer Cluster
Purpose of Travel (if available, e.g., leisure vs. business)
Length of Stay (which can be both an input and an output)
Time of Year
Whether the booking is for a group or event.
How to use it:
Inventory and Revenue Management: Predicting the quantity of rooms likely to be booked by a segment allows hotels to manage room blocks more effectively. If a trade team knows a particular corporate client typically books in blocks of 20 rooms, they can prioritize that relationship.
Resource Planning: A forecast of high quantity bookings for a specific period alerts destination managers to prepare for larger groups, impacting everything from airport transfers to restaurant reservations and attraction capacity.
Upsell and Cross-sell Triggers: If a customer from a high-volume cluster is only booking a single room, it could trigger an automated offer for connecting rooms or a larger suite.
Practical Step: Using statsmodels.api.GLM (Generalized Linear Model) with a Poisson or Negative Binomial family, you can fit this model to your historical booking data, where the target variable is the Quantity column.
10) Deep Learning for Conversion Prediction: A Simple Neural Net
While the previous models are powerful and interpretable, Deep Learning (using Neural Networks) offers a more flexible, “black-box” approach that can capture extremely complex, non-linear relationships in the data that simpler models might miss. For a tourism board, a primary application is building a highly accurate conversion prediction engine.
Why Use It? A neural network can automatically learn intricate interactions between features. For example, it might discover that the combination of “Source Market = Germany,” “Channel = Mobile Web,” and “Season = Winter” leads to a dramatically higher conversion rate than any of those factors alone would suggest. It models these complex patterns without you having to manually specify them.
The “Simple” Neural Net: A basic feedforward neural network for this binary classification task would consist of:
Input Layer: One node for each input feature (e.g., cluster, channel, promo status).
Hidden Layers: One or two layers of “neurons” that perform complex transformations on the inputs. This is where the model learns its patterns. Using a library like Keras makes defining these layers straightforward.
Output Layer: A single node with a sigmoid activation function that outputs the probability of conversion.
How to use it:
Hyper-Personalization in Real-Time: The model’s prediction can be fed into a website’s content management system to dynamically assemble the most effective landing page for that specific user, combining imagery, copy, and offers that the model associates with a high likelihood of conversion for their profile.
Optimizing Digital Ad Bids: The probability score can be used in programmatic advertising platforms to determine how much to bid for that specific user’s attention. A user with a 90% predicted conversion probability is worth a much higher bid than one with a 5% probability.
Practical Step: Using the tensorflow and keras libraries, you can construct and train a neural network. The process involves defining the model architecture, compiling it with an optimizer (like adam), and fitting it to your training data. It is crucial to hold out a portion of the data for testing to ensure the model generalizes well and does not just “memorize” the training data (a problem known as overfitting).
Conclusion: From Data to Direction,A Practical Blueprint for Action
The journey through this customer-analytics pipeline demonstrates a clear and attainable path from raw, unstructured data to refined, strategic direction. We began by emphasizing that the power of modern analytics is not reserved for tech giants with vast resources but is accessible to any tourism organization willing to adopt a systematic, step-by-step approach.
The workflow progresses logically:
Foundation: We start by building a clean, standardized Segmentation Data table, the single source of truth that describes each destination-market pair through a balanced scorecard of performance and behavioral metrics.
Understanding: We use Hierarchical Clustering to explore the natural groupings in our portfolio and then employ K-Means Clustering to assign operational, actionable segment labels. PCA provides the visual proof, translating complex, multi-dimensional data into an intuitive 2D map that anyone in the organization can understand.
Prediction: We then shift gears to forecast future behavior. Using straightforward purchase data, we build models that answer the core commercial questions: Purchase Incidence (Will they book?), Brand Choice (Which one?), and Purchase Quantity (How much?). Each model provides levers for personalization and optimization.
Optimization: Finally, we touch upon the advanced power of Deep Learning, a simple neural network capable of detecting subtle patterns to drive hyper-personalized marketing and maximize conversion rates.
The ultimate output of this process is not a set of complex charts or an academic report; it is a practical blueprint for action. It is a document that can be handed to a marketing team, instructing them to target “Cluster 0” with early-bird offers in Q1, to develop luxury content for “Cluster 1,” and to serve mobile-specific promo codes to “Cluster 2” during the last 72 hours before a weekend. It equips trade teams with a data-driven rationale for prioritizing partner outreach and customizing their sales pitches.
In an industry defined by competition for attention and spending, the ability to spend smarter, target more precisely, and personalize more effectively is the ultimate competitive advantage. This guide proves that this advantage is within reach. By demystifying the analytics process and linking each step directly to tangible business outcomes, tourism boards and travel-trade teams can confidently move from relying on gut feeling to being guided by data intelligence, ensuring they not only survive but thrive in the new era of travel.
11) Operationalizing the Analytics: From Models to Marketing Actions
The most sophisticated analytics pipeline is useless if its insights remain trapped in a Jupyter notebook. The final and most crucial step is operationalization,embedding the outputs of your models into daily workflows, marketing systems, and decision-making processes. This is where data science transforms into business value.
Creating the 360-Degree Customer View: The first action is to consolidate all outputs into a single, accessible customer profile. This can be achieved by creating a master database or CRM table that links:
Customer_ID or Session_ID
Assigned Segment/K-Means Cluster label
Purchase Incidence Probability Score (from Logistic Regression or Neural Net)
Integration into Marketing Automation: This enriched customer data can be piped into marketing automation platforms (e.g., Salesforce Marketing Cloud, HubSpot) via APIs. This enables hyper-segmented campaign execution:
Example 1: A workflow triggers automatically when a user from “Cluster 3 (Loyal Return Visitors)” has a high Purchase Incidence score but hasn’t booked in 9 months. They receive a “We Miss You” email with a personalized offer for their historically preferred hotel brand.
Example 2: A user from “Cluster 2 (Mobile-First Deal Chasers)” browsing on a mobile device during a peak booking period (identified by descriptive analysis) is served a push notification with a time-sensitive, mobile-only promo code for hotels the Brand Choice model predicts they will prefer.
Dynamic Content on Digital Properties: Using a tag management system and a real-time API endpoint hosting your models, you can personalize website and app content instantly:
A high-value user (high predicted quantity and ADR) from “Cluster 1 (Premium Seekers)” might see a homepage hero section featuring luxury resorts and private tours.
A price-sensitive user from Cluster 2 might see a prominent banner highlighting “Today’s Top Deals” and budget-friendly packages.
Sales and Trade Team Enablement: The analytics should be translated into actionable intelligence for human teams:
Lead Prioritization Dashboard: A simple dashboard for the travel-trade team ranks incoming leads (e.g., from trade shows) by their predicted lifetime value (a composite of incidence, quantity, and ADR predictions), ensuring they focus efforts on the most promising accounts first.
Talking Points and Playbooks: Each cluster should have a dedicated one-page playbook. For example, the playbook for “Cluster 0 (Planned Volume Drivers)” would advise sales teams to “Focus on early-bird contracts and group booking incentives; initiate conversations 6-8 months out.”
12) Measuring Impact and Establishing a Feedback Loop
An analytics initiative is not a one-time project but an ongoing cycle. Establishing robust measurement and a feedback loop is essential for continuous improvement and proving ROI.
Define Key Performance Indicators (KPIs): Link your analytical actions directly to business outcomes. For each cluster-based campaign, track:
Uplift in Conversion Rate: Did the personalized offer for Cluster 2 increase mobile conversion by 15% as predicted?
Incremental Revenue: Calculate the additional revenue generated from customers who converted due to a model-triggered intervention compared to a control group.
Increase in Average Order Value (AOV): Did the premium content for Cluster 1 succeed in maintaining a higher ADR?
Reduction in Customer Acquisition Cost (CAC): Did targeting high-propensity-to-convert segments lower the cost to acquire a new booking?
A/B Testing as a Standard Practice: Never assume your model’s recommendation is the final word. Always test.
For every model-driven campaign (Version A), run a control campaign (Version B) that uses the old, rules-based segmentation or a generic message.
This rigorously validates the model’s value and provides new data to refine the next iteration of models.
The Feedback Loop: The results of these campaigns and A/B tests are not the end. They are the beginning of the next cycle.
Data Collection: The outcomes (e.g., did they click? did they book?) are fed back into your database.
Model Retraining: Periodically (e.g., quarterly), your Purchase Incidence, Brand Choice, and Quantity models are retrained on this new, larger dataset that includes the results of your own marketing actions.
Cluster Re-evaluation: As market conditions change,a new competitor emerges, a global event shifts travel patterns,the customer segments will evolve. Running the K-Means clustering annually on fresh data ensures your segments remain accurate and relevant.
This continuous cycle of Measure -> Learn -> Update -> Act ensures your analytics pipeline is a living, breathing asset that grows smarter over time, constantly adapting to the market and maximizing the efficiency of your marketing spend.
Final Synthesis: The Non-Technical Manager’s Guide to Implementation
For the tourism CEO, Marketing Director, or Head of Sales, the technical details are less important than the operational roadmap. Here is a concise, phased plan for implementation:
Phase 1: Foundation (Months 1-2)
Assemble the Team: Identify a data-literate champion in your organization. Partner with a freelance data scientist or a tech-savvy agency if internal expertise is limited.
Data Audit and Consolidation: Identify all data sources (booking engines, CRM, website analytics, partner reports). Export a unified CSV of destination-market data as described in Section 1.
Quick-Win Descriptive Analysis: Perform the analyses from Section 6. Use these immediate insights to build momentum and secure buy-in from stakeholders.
Run Clustering and PCA: Follow the steps in Sections 2, 3, and 4. The primary goal here is to get the initial cluster definitions and a compelling visualization (the PCA plot) to align the entire organization on a new, data-driven view of the customer base.
Develop Cluster Playbooks: Translate each cluster profile into a one-page marketing and sales strategy document.
Build and Validate Core Models: Start with the Purchase Incidence model (Section 7). It often provides the most direct value. Then, progressively build the Brand Choice and Quantity models (Sections 8 & 9).
Pilot a Campaign: Select one cluster (e.g., the Loyal Return Visitors) and run a small, model-informed pilot campaign. Measure its performance rigorously against a control.
Phase 4: Scale & Operationalize (Ongoing)
Integrate with Tech Stack: Work with your IT team or agency to connect the model outputs to your CRM and marketing automation platforms.
Establish the Feedback Loop: Implement the measurement and retraining cycle outlined in Section 12.
Foster a Data-Driven Culture: Share successes and learnings widely. Train sales and marketing teams on how to use the new dashboards and playbooks.
Conclusion: The End of the Beginning
This guide has traversed the entire landscape of modern customer analytics for the travel trade, from the foundational principles of data preparation to the advanced frontiers of deep learning and operational integration. We have demonstrated that what might seem like an arcane, technical discipline is, in reality, a structured, logical, and,most importantly,accessible process.
The journey begins not with code, but with curiosity. It starts by asking better questions: Not “Which markets are big?” but “Which markets behave in similar, targetable ways?” Not “Did our campaign work?” but “For which specific customer segment did our campaign work best, and why?”
The techniques outlined,clustering, PCA, logistic regression, neural networks,are merely tools to answer these better questions. They are the means to an end. That end is a fundamental shift from spray-and-pray marketing to surgical, evidence-based strategy. It is the ability to know your customer so well that you can anticipate their needs, personalize their experience, and build the loyalty that turns visitors into advocates.
In the competitive, experience-driven world of travel and tourism, intuition is no longer enough. The winners will be those who learn to listen to the story their data is telling. This essay provides the dictionary to understand that language and the blueprint to build the systems that act upon it. The first step is to begin. Export your data, look at it with fresh eyes, and start asking better questions. Your most valuable customers,and your bottom line,are waiting to be discovered.
13) Overcoming Common Implementation Challenges
While the roadmap is clear, the path to becoming a data-driven organization is often fraught with practical hurdles. Acknowledging and planning for these challenges is critical for success.
Data Quality and Silos:
The Problem: The initial data audit often reveals incomplete, inconsistent, or siloed data. Booking data sits in one system, website analytics in another, and CRM data in a third.
The Solution: Start with a “good enough” approach. Don’t let the pursuit of perfect data paralyze you. Begin by integrating the two or three most critical data sources (e.g., booking engine and a core market list). Use a unique identifier, like an email address or a booking ID, to stitch records together. Establish a data governance policy that mandates clean data entry at the source.
Resource and Skill Gaps:
The Problem: Many tourism boards and travel trade teams lack in-house data scientists.
The Solution: Adopt a hybrid model.
Upskill Existing Talent: Identify a marketing analyst or a tech-savvy manager who can learn to run pre-built Python scripts. The steps in this guide are designed to be repeatable by non-experts.
Leverage Freelancers & Agencies: Contract a data scientist for the initial model setup and training. Once the pipeline is built, the maintenance and execution can often be handled by the upskilled internal team.
Use No-Code/Low-Code Tools: While this guide uses Python for its power and flexibility, several platforms offer user-friendly interfaces for clustering and segmentation. The underlying logic remains the same.
Resistance to Change:
The Problem: Sales and marketing teams may be skeptical of a “black box” model overriding their years of experience and intuition.
Solution: Co-creation and transparency.
Involve Teams Early: Include sales and marketing leads in the process of defining the clusters. When they help name and describe the segments (e.g., “The Luxury Explorers”), they develop a sense of ownership.
Frame Models as Assistants, Not Replacements: Position the analytics as a tool to augment human expertise, not replace it. The model can prioritize 1,000 leads, but the salesperson’s relationship-building skills are what ultimately close the deal with the top 50.
Show, Don’t Tell: Run a pilot campaign for a skeptical stakeholder. A side-by-side comparison showing a 30% lift in conversion for the model-driven approach is the most powerful argument for change.
14) Ethical Considerations and Data Privacy
In an era of increasing regulation (like GDPR and CCPA) and consumer privacy awareness, using customer data responsibly is not just a legal obligation but a brand imperative.
Transparency and Consent:
Be clear with users about what data you are collecting and how it will be used to improve their experience. This information should be easily accessible in your privacy policy.
Where required, ensure you have explicit consent for marketing personalization and data processing.
Avoiding Bias and Discrimination:
Machine learning models can inadvertently perpetuate and amplify existing biases present in the historical data.
Example: If a model learns that a certain postal code has a low historical conversion rate, it might systematically offer fewer premium offers to users from that area, creating a discriminatory feedback loop.
Mitigation: Regularly audit model predictions for fairness across different demographic groups. Use techniques like “fairness-aware modeling” and ensure human oversight for high-stakes decisions.
Value Exchange, Not Exploitation:
The goal of personalization is to create a better, more relevant experience for the traveler, not to manipulate them.
Use predictions to inspire with content they’ll love or to save them time with relevant offers,not just to extract maximum value from every transaction. Building trust through ethical data use is a long-term competitive advantage.
15) The Future Frontier: Next Steps in Travel Analytics
The pipeline described is the foundation. As the organization matures in its analytics journey, it can explore more advanced frontiers:
Integrating Unstructured Data:
Move beyond spreadsheets and databases. Use Natural Language Processing (NLP) to analyze:
Customer Reviews: Uncover the specific amenities, experiences, or pain points mentioned most frequently for different segments.
Social Media Conversations: Identify emerging travel trends, destination desires, and unmet needs in real-time.
Competitor Intelligence: Automatically monitor and analyze the marketing messages and pricing strategies of competing destinations.
Predictive Lifetime Value (LTV) Modeling:
Go beyond predicting a single transaction. Develop a model that forecasts the total future value of a customer or a source market. This allows for truly strategic budget allocation, where you can justify higher acquisition costs for segments that deliver superior long-term value.
AI-Driven Dynamic Pricing and Offer Generation:
Integrate the Brand Choice and Quantity models with real-time demand signals (search volume, flight availability, event calendars) to create a system that can automatically generate and test optimized, personalized package offers with dynamic pricing, maximizing both conversion and yield.
Final Word: The Transformative Power of a Data-Driven Mindset
This comprehensive guide has provided a detailed, step-by-step framework for building a customer analytics capability from the ground up. We have moved from the theoretical “why” to the practical “how,” covering the entire spectrum from data preparation to ethical deployment.
However, the most important takeaway transcends any specific technique or model. The true transformation occurs when an organization internalizes a data-driven mindset. This is a culture where:
Decisions are challenged with “What does the data say?” before finalizing a strategy.
Hypotheses are tested systematically through A/B tests rather than debated in meeting rooms.
Failure is viewed as data,an opportunity to learn and refine the next approach.
Every team member, from the CEO to the intern, is empowered to ask questions and seek evidence in the data.
For tourism boards and travel-trade teams, this is not merely an efficiency gain. It is a paradigm shift. It is the difference between shouting a generic message into a crowded room and having a curated, personal conversation with a valued guest. It enables you to be proactive rather than reactive, to anticipate demand rather than just report on it, and to build lasting relationships rather than just process transactions.
The tools and the blueprint are now in your hands. The journey to becoming a truly intelligent, responsive, and customer-centric organization begins with a single, deliberate step: deciding to start.
No code was provided here, if interested in code please reach out, thank you.
References
Anguita, D., Ghelardoni, L., Ghio, A., Oneto, L., & Ridella, S. (2012). The ‘K’ in K-fold cross validation. In 20th European Symposium on Artificial Neural Networks, Computational Intelligence and Machine Learning (ESANN) (pp. 441-446). i6doc.com.
Bishop, C. M. (2006). Pattern recognition and machine learning. Springer.
Chollet, F., & Allaire, J. J. (2018). Deep learning with R. Manning Publications.
Hastie, T., Tibshirani, R., & Friedman, J. (2009). The elements of statistical learning: Data mining, inference, and prediction (2nd ed.). Springer. https://doi.org/10.1007/978-0-387-84858-7
Hunter, J. D. (2007). Matplotlib: A 2D graphics environment. Computing in Science & Engineering, *9*(3), 90–95. https://doi.org/10.1109/MCSE.2007.55
Jain, A. K., & Dubes, R. C. (1988). Algorithms for clustering data. Prentice-Hall, Inc.
Jolliffe, I. T., & Cadima, J. (2016). Principal component analysis: A review and recent developments. Philosophical Transactions of the Royal Society A: Mathematical, Physical and Engineering Sciences, 374(2065), 20150202. https://doi.org/10.1098/rsta.2015.0202
Kotler, P., Bowen, J. T., & Makens, J. (2014). Marketing for hospitality and tourism (6th ed.). Pearson Education.
McKinney, W. (2010). Data structures for statistical computing in Python. In S. van der Walt & J. Millman (Eds.), Proceedings of the 9th Python in Science Conference (pp. 56–61). https://doi.org/10.25080/Majora-92bf1922-00a
Pedregosa, F., Varoquaux, G., Gramfort, A., Michel, V., Thirion, B., Grisel, O., Blondel, M., Prettenhofer, P., Weiss, R., Dubourg, V., Vanderplas, J., Passos, A., Cournapeau, D., Brucher, M., Perrot, M., & Duchesnay, É. (2011). Scikit-learn: Machine learning in Python. Journal of Machine Learning Research, 12, 2825–2830.
Peltier, J. W., Schibrowsky, J. A., & Davis, J. (2020). The evolution of customer data analysis and the future of marketing. Journal of Marketing Analytics, 8(3), 119–132. https://doi.org/10.1057/s41270-020-00084-6
Virtanen, P., Gommers, R., Oliphant, T. E., Haberland, M., Reddy, T., Cournapeau, D., Burovski, E., Peterson, P., Weckesser, W., Bright, J., van der Walt, S. J., Brett, M., Wilson, J., Millman, K. J., Mayorov, N., Nelson, A. R. J., Jones, E., Kern, R., Larson, E., … SciPy 1.0 Contributors. (2020). SciPy 1.0: Fundamental algorithms for scientific computing in Python. Nature Methods, 17(3), 261–272. https://doi.org/10.1038/s41592-019-0686-2
Waskom, M. L. (2021). seaborn: statistical data visualization. Journal of Open Source Software, 6(60), 3021. https://doi.org/10.21105/joss.03021
Wedel, M., & Kamakura, W. A. (2000). Market segmentation: Conceptual and methodological foundations (2nd ed.). Kluwer Academic Publishers.
Wolpert, D. H., & Macready, W. G. (1997). No free lunch theorems for optimization. IEEE Transactions on Evolutionary Computation, 1(1), 67–82. https://doi.org/10.1109/4235.585893
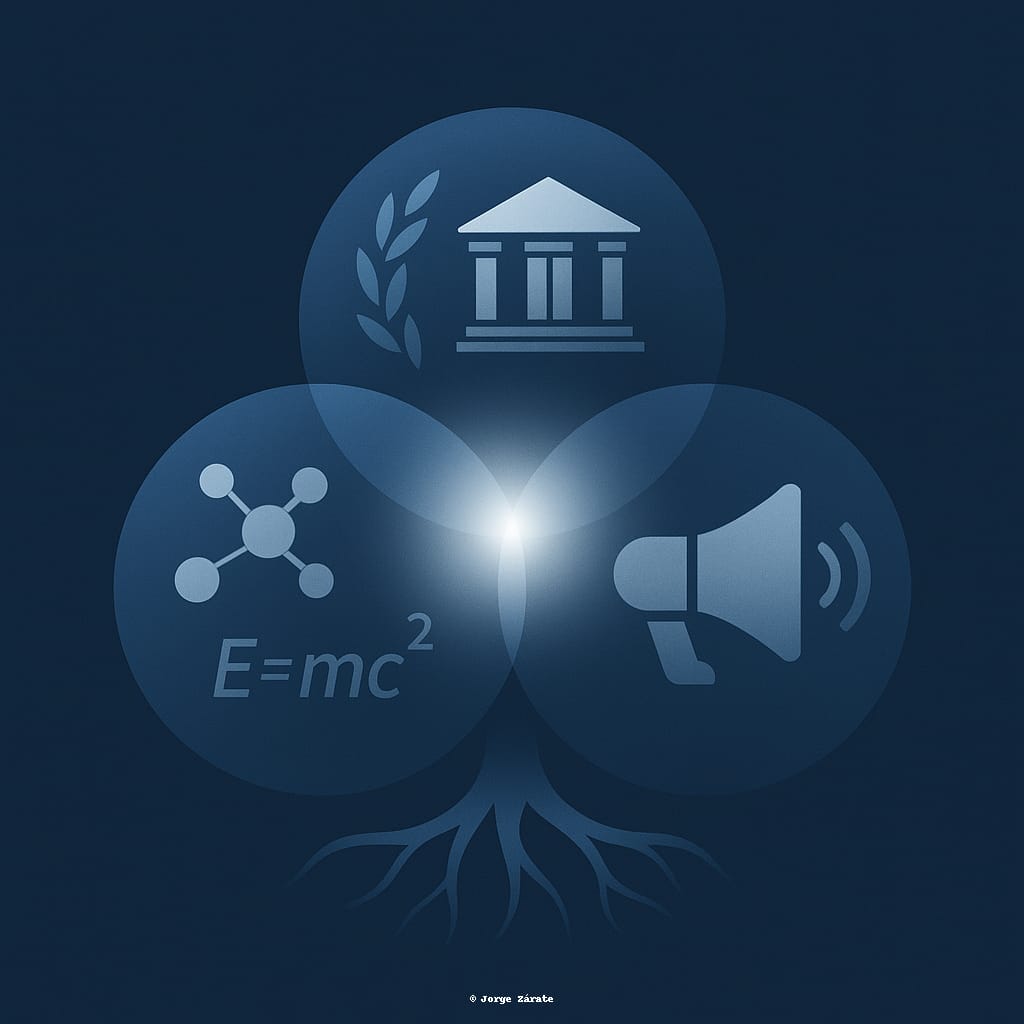
La Tríada Fundamental: Ciencia, Política y Relaciones Públicas en la Construcción del Progreso
Jorge Zárate
Introducción: La Paradoja del Progreso
En el corazón de la empresa humana late una pregunta fundamental: ¿cómo transformamos el conocimiento abstracto en progreso tangible? La historia de la civilización es, en gran medida, la crónica de esta transformación. Sin embargo, en la era moderna, este proceso se ha vuelto extraordinariamente complejo, mediado por tres fuerzas aparentemente dispares pero profundamente entrelazadas: la ciencia, la política y las relaciones públicas. A menudo, se debate cuál de estos dominios tiene la primacía o es el motor inicial del cambio. ¿Es el descubrimiento científico puro (la “ciencia básica”) el que impulsa la innovación? ¿O es la voluntad política la que establece la agenda y financia la investigación? ¿Acaso son las relaciones públicas, la narrativa y la percepción pública, las que determinan qué se investiga y qué se implementa?
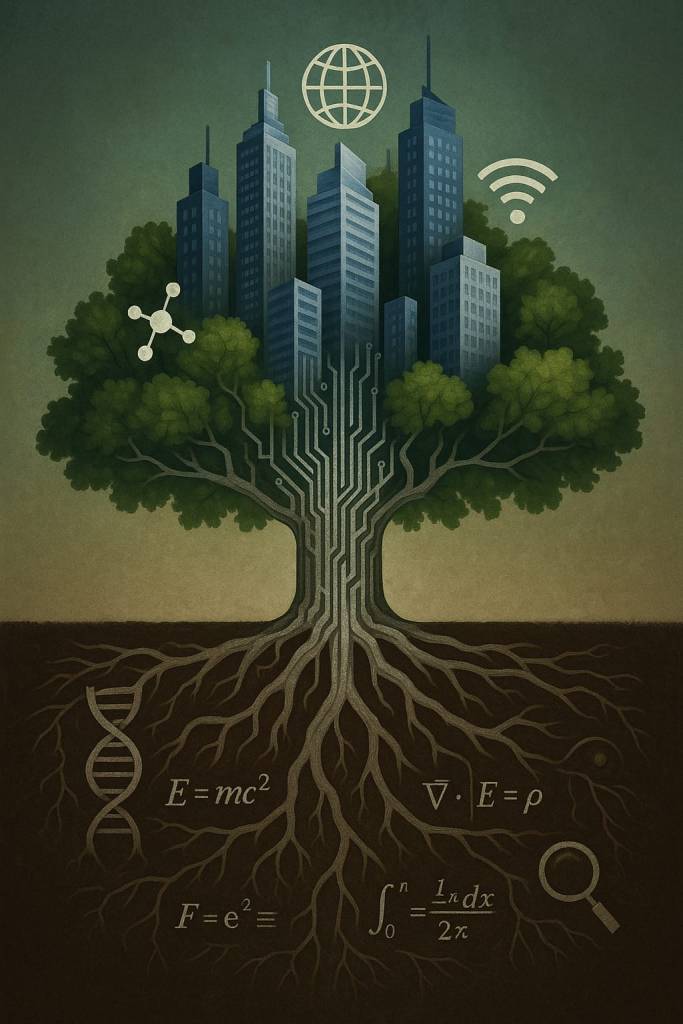
Este ensayo postula que, si bien la ciencia básica es ontológica y temporalmente primera, es el manantial original de todo conocimiento verificable, su capacidad para “medir resultados y trascender” depende críticamente de un ecosistema de apoyo donde la política y las relaciones públicas actúan como facilitadores esenciales, aunque a menudo problemáticos. La ciencia reside en el reino de lo que es, la política en el de lo que debe ser, y las relaciones públicas en el puente entre ambos: la percepción de lo que es y podría ser. El objetivo final es demostrar que subordinar la ciencia básica a los intereses políticos de corto plazo o a las campañas de comunicación superficiales es un error catastrófico. Solo entendiendo y dando lugar a la investigación fundamental no dirigida podemos sentar las bases para una medición rigurosa de los resultados y una trascendencia genuina que beneficie a la humanidad a largo plazo. Para ello, es imperativo analizar el rol de cada elemento en este ecosistema y el espacio –a menudo conflictivo– donde se encuentran, con especial atención a un sector donde esta interacción resulta particularmente visible: el de los viajes y el turismo.
I. La Primacía Ontológica de la Ciencia Básica: El Manantial del Conocimiento
La ciencia básica o pura es la búsqueda del conocimiento por el conocimiento mismo, sin una aplicación práctica inmediata en mente. Es, sin lugar a dudas, el punto de partida ontológico. Su valor reside en su método: un proceso riguroso, sistemático y autocorrectivo de observación, experimentación y verificación que busca describir y entender los mecanismos fundamentales de la naturaleza y la sociedad.
La historia está repleta de ejemplos que demuestran cómo investigaciones aparentemente arcanas y desconectadas de la realidad dieron lugar a las revoluciones tecnológicas y médicas más transformadoras. El trabajo de James Clerk Maxwell en el siglo XIX sobre las ecuaciones del electromagnetismo no tenía como objetivo crear la radio o la televisión; buscaba comprender una fuerza fundamental del universo. Sin embargo, sus ecuaciones son la base de todas las telecomunicaciones modernas (Greenberg, 2015). De manera similar, la investigación en mecánica cuántica, iniciada por científicos como Erwin Schrödinger y Werner Heisenberg para resolver paradojas teóricas, fue esencialmente un ejercicio de ciencia básica. Medio siglo después, es el fundamento de los transistores, los láseres y toda la computación moderna (Isaacson, 2014).
El caso más paradigmático es quizás el del descubrimiento de la estructura del ADN por Watson y Crick. Su hallazgo en 1953 fue un triunfo de la ciencia básica, impulsado por la curiosidad intelectual. No tenían un plan para curar enfermedades genéticas; simplemente querían descifrar la arquitectura de la vida. Ese conocimiento básico se convirtió en la piedra angular de la biotecnología, la medicina genómica y la criminología forense, campos que hoy “miden resultados” y “trascienden” de maneras que eran inimaginables en su momento (Maddox, 2003).
En el ámbito del turismo, este principio se manifiesta de forma igualmente crucial. La ecología de sistemas y la ciencia climática (ciencia básica) proporcionan los modelos predictivos esenciales para entender el impacto del turismo de masas en frágiles ecosistemas, como arrecifes de coral o reservas naturales. Sin esta investigación fundamental, no tendríamos las métricas para medir la degradación ambiental. La validación por pares de estos estudios es lo que da credibilidad a las alertas sobre la capacidad de carga de los destinos. Investigaciones en psicología social y antropología cultural, aparentemente abstractas, proveen el marco para comprender las dinámicas entre visitantes y comunidades locales, esencial para diseñar modelos de turismo sostenible.
Por lo tanto, la ciencia básica es primero porque es la fuente de todo conocimiento aplicado. Sin ella, no hay nada que aplicar, nada que medir y nada que comunicar. Es el depósito de ideas del cual la innovación futura extrae sus recursos. Subestimarla o financiarla de manera insuficiente equivale a comerciar el futuro por una gratificación inmediata.
II. El Espacio de Encuentro: La Intersección Crítica con la Política y las Relaciones Públicas
Sin embargo, la ciencia no existe en el vacío. Opera dentro de un contexto social, económico y político que determina en gran medida su dirección, su financiamiento y su impacto. Es en este espacio de intersección donde la primacía ontológica de la ciencia choca con la realidad de su implementación.
A. La Política: El Árbitro de los Recursos y la Agenda
La política es el proceso mediante el cual las sociedades toman decisiones colectivas, asignan recursos y establecen prioridades. En este sentido, la política es el mecanismo que decide qué ciencia se financia, cuánto se le destina y con qué objetivos sociales amplios debe alinearse. La política convierte el conocimiento (lo que es) en acción (lo que debe hacerse).
La relación es simbiótica pero tensa. La ciencia proporciona a la política la evidencia necesaria para tomar decisiones informadas sobre temas críticos como el cambio climático, la salud pública o la energía. A cambio, la política proporciona a la ciencia la estabilidad financiera y el marco institucional para florecer. El establecimiento de agencias como la NASA o los Institutos Nacionales de Salud (NIH) en Estados Unidos son ejemplos de decisiones políticas monumentales que canalizaron recursos masivos hacia la ciencia básica y aplicada, con resultados transformadores (Greenberg, 2015).
El peligro surge cuando la política intenta subordinar la ciencia a sus ciclos electorales o ideologías. La politización de la ciencia –ya sea negando el consenso científico sobre el cambio climático, interfiriendo en la investigación de salud pública o dirigiendo fondos únicamente a proyectos de aplicación inmediata y visible– corroe el proceso científico. La ciencia se ve forzada a producir los resultados que el poder desea oír, en lugar de la verdad incómoda que necesita escuchar. Como señala Oreskes (2019), la negación organizada de la ciencia climática es un caso de estudio sobre cómo los intereses políticos y económicos pueden manipular la narrativa pública, socavando la capacidad de la sociedad para responder a una amenaza existencial basándose en evidencia.
En el sector de viajes y turismo, esta dinámica es particularmente evidente. Durante la pandemia de COVID-19, la epidemiología y la ciencia de datos (ciencia aplicada) generaron evidencia crucial sobre los patrones de contagio. Las políticas de restricción de viajes, cuarentenas y protocolos sanitarios en aeropuertos que se basaron en esta evidencia fueron mucho más efectivas para mitigar los impactos sanitarios y, a la larga, permitieron una reapertura más segura y rápida que aquellas dictadas por intereses políticos o económicos cortoplacistas. La política turística informada por la ciencia demostró ser no solo más ética sino también más efectiva económicamente a medio plazo.
B. Las Relaciones Públicas: El Puente Narrativo hacia la Sociedad
Si la política es el árbitro de los recursos, las relaciones públicas (RR. PP.) son el mecanismo de traducción y persuasión. Su función es comunicar la ciencia de manera comprensible, accesible y convincente para el público, los medios de comunicación y los propios políticos. En un mundo saturado de información, la mera existencia de un hecho científico no es suficiente; debe ser contextualizado, explicado y enmarcado para que resuene y motive la acción.
Las RR. PP. son cruciales para construir lo que Callon (1999) denomina “investigación concertada”, donde científicos, políticos, industrias y ciudadanos colaboran en la definición de problemas y la búsqueda de soluciones. Una comunicación científica efectiva puede generar apoyo público para la financiación de la ciencia básica, explicando su valor a largo plazo de manera elocuente. Las campañas de concientización sobre enfermedades raras, por ejemplo, han logrado movilizar recursos tanto privados como públicos para la investigación, demostrando el poder de la narrativa (Fischhoff & Scheufele, 2013).
No obstante, este poder conlleva una gran responsabilidad ética. El riesgo inherente es la simplificación excesiva, la sensacionalización o, en el peor de los casos, la distorsión deliberada. Cuando las RR. PP. priorizan el mensaje sobre la integridad de los datos, se convierten en propaganda. La comunicación de riesgos, por ejemplo, es un campo minado: minimizar un riesgo para evitar el pánico o exagerarlo para atraer fondos son tentaciones constantes que pueden erosionar la confianza pública, el activo más valioso de la ciencia (Fischhoff & Scheufele, 2013). La “ciencia” comunicada se convierte en un espectáculo, divorciada de su rigor metodológico y su esencia crítica.
En el contexto turístico, una vez que la política definió protocolos basados en ciencia durante la pandemia, el reto fue comunicarlos. Campañas como “Safe Travels” del World Travel & Tourism Council (WTTC) o los sellos de turismo seguro de varios países ejemplifican el rol de las RR. PP. Su objetivo fue traducir complejos protocolos sanitarios en un mensaje claro y tranquilizador para los viajeros, reconstruyendo la confianza y allanando el camino para la recuperación. Esta comunicación efectiva fue tan crucial como las propias medidas sanitarias para la supervivencia del sector.
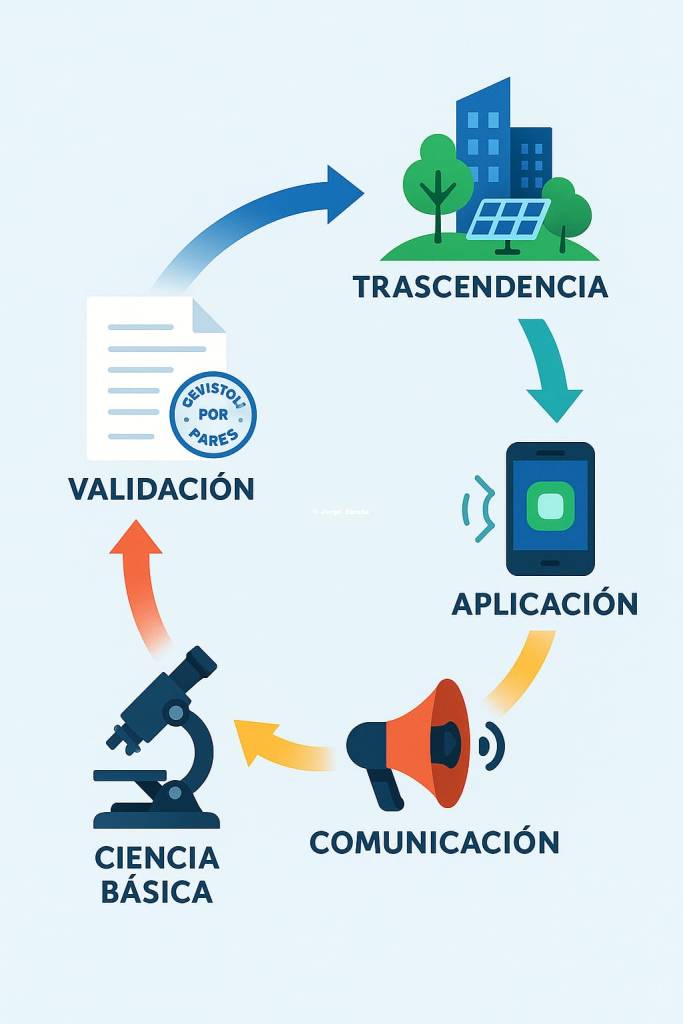
III. El Ciclo Virtuoso: De la Curiosidad a la Trascendencia
El camino desde un descubrimiento científico básico hasta su trascendencia en la sociedad sigue un ciclo virtuoso, aunque no lineal, que requiere la participación armoniosa de los tres elementos:
Origen (Ciencia Básica): Un científico o grupo de científicos, impulsados por la curiosidad, investiga un fenómeno fundamental sin un uso práctico predefinido. Ejemplo: La investigación en enzimas de restricción en bacterias o el estudio de los ecosistemas marinos.
Validación y Comunicación Interna (Ciencia): El descubrimiento es revisado por pares y publicado en literatura especializada, entrando al acervo del conocimiento humano. Esta fase es el control de calidad que asegura el rigor.
Traducción y Advocacy (Relaciones Públicas de la Ciencia): Los comunicadores científicos, las universidades y los propios investigadores explican la potencial importancia del hallazgo a un público más amplio, generando interés y comprensión.
Financiamiento y Marco (Política): Los legisladores y agencias de funding, informados por la comunidad científica y la opinión pública, deciden invertir en esta línea de investigación, reconociendo su potencial a largo plazo. Ejemplo: La financiación sostenida del Proyecto del Genoma Humano o la inversión en proyectos de destinos turísticos inteligentes.
Aplicación y Medición (Ciencia Aplicada y Política): El conocimiento básico se convierte en tecnología o aplicación práctica (terapias genéticas, tests de ADN, sistemas de gestión de visitantes). Su impacto es medido rigurosamente (resultados en salud, eficacia, coste-beneficio, impacto ambiental).
Implementación y Trascendencia (Política y Sociedad): Las políticas públicas incorporan estos avances (nuevos tratamientos en el sistema de salud, nuevas regulaciones forenses, límites de capacidad turística). La comunicación continua (RR. PP.) asegura la aceptación y el uso adecuado.
La ruptura de este ciclo en cualquier punto tiene consecuencias nefastas. Si falla la ciencia básica (fase 1), el ciclo nunca comienza. Si falla la validación (fase 2), se pierde credibilidad. Si falla la comunicación (fase 3), el descubrimiento muere en una torre de marfil. Si falla la política (fase 4), no hay recursos para convertir la idea en realidad. Y si la comunicación se corrompe (fase 3 o 6), se siembra la desconfianza y se obstruye la implementación.
IV. Aplicación en el Sector de Viajes y Turismo: Un Caso Práctico
La teoría de la tríada ciencia-política-relaciones públicas encuentra un campo de aplicación inmediato y vital en el sector de viajes y turismo, una de las industrias más grandes y sensibles del mundo. Este sector es un ejemplo paradigmático de cómo este ciclo virtuoso puede impulsar la recuperación, la resiliencia y la transformación sostenible.
Recomendaciones de Aplicación para el Sector:
Para que el sector de viajes y turismo trascienda hacia un modelo más resiliente, sostenible y próspero, debe adoptar conscientemente el marco de la tríada:
Para los Científicos y Académicos (Ciencia):
Investigar con Contexto: Dirigir la investigación hacia los problemas más apremiantes del sector: modelado de flujos turísticos para evitar la saturación, desarrollo de materiales y logística de baja huella de carbono, estudios de psicología del consumidor post-pandemia, y análisis de impacto económico real del turismo en comunidades locales.
Comunicar de Manera Accesible: Traducir los hallazgos complejos en informes ejecutivos, dashboards de datos y recomendaciones accionables para empresarios y creadores de políticas, facilitando así la transición a la fase de política.
Para los Gobiernos y Autoridades (Política):
Crear Mesas de Diálogo Tripartitas: Establecer foros permanentes donde científicos, empresarios turísticos y responsables políticos diseñen conjuntamente la estrategia nacional de turismo. Esto evita que la política opere en el vacío.
Financiar con Visión: Actuar como “inversor de primer resort” en I+D+i turística. Ejemplos: financiar proyectos piloto de destinos inteligentes (smart destinations), subsidiar la transición energética de pymes hoteleras basándose en evidencia técnica, o crear observatorios turísticos que midan impactos con rigor científico, no solo volumen de visitantes.
Legislar con Base en Evidencia: Utilizar los datos científicos sobre capacidad de carga para legislar sobre límites de visitantes a espacios naturales protegidos, en lugar de ceder a la presión por maximizar números a corto plazo.
Para los Empresarios y Comunicadores (Relaciones Públicas):
Adoptar y Comunicar la Verdad Científica: Las campañas de marketing deben basarse en atributos reales y verificables (ej.: “carbono neutral certificado por X organismo”) y no en greenwashing o mensajes vagos. La autenticidad construye confianza a largo plazo.
Educar al Viajero: Utilizar los canales de comunicación para explicar al turista el porqué de ciertas medidas (por qué no se puede usar protector solar en ciertos arrecifes, por qué hay que pagar una tasa de conservación). Esto transforma una restricción en una experiencia de consumo consciente y de mayor calidad.
Gestionar Crisis con Transparencia: En caso de una crisis (climática, sanitaria, de seguridad), la comunicación debe priorizar la precisión y la seguridad, coordinándose con las recomendaciones de las autoridades científicas y políticas para emitir un mensaje unificado y creíble.
V. Conclusión: Dar Lugar a la Ciencia para Asegurar el Futuro
La pregunta “¿qué es primero?” encuentra así una respuesta clara: la ciencia básica es la primera en el orden del ser y del conocer. Es el cimiento indispensable. Sin embargo, para “medir resultados y trascender”, debe insertarse en un ecosistema donde la política y las relaciones públicas no sean amos distorsionadores, sino sirvientes ilustrados.
La política debe actuar como un mecenas visionario, no como un capataz de corto plazo. Debe crear marcos estables de financiamiento para la ciencia básica, protegiéndola de los vaivenes ideológicos y confiando en el criterio de la comunidad científica para identificar las líneas de investigación más prometedoras, aunque su aplicación no sea inmediatamente obvia. Como argumenta Mazzucato (2018), el Estado debe ser un inversor de primer resort, asumiendo riesgos que el sector privado evita, para crear los mercados del futuro a partir de la ciencia fundamental.
Las relaciones públicas, por su parte, deben abrazar un código de ética riguroso que priorice la precisión sobre el impacto, la educación sobre la persuasión. Su rol no es vender la ciencia, sino tender puentes de comprensión. Deben combatir la desinformación no con eslóganes, sino con una pedagogía constante que empodere a los ciudadanos para distinguir la evidencia de la opinión.
El objetivo final de entender esta tríada es construir una sociedad más resiliente, próspera y racional. Como demostró la aplicación al sector de turismo, integrar este ciclo virtuoso permite a las industrias dejar de ser reactivas y convertirse en líderes proactivos. Al dar lugar a la ciencia para medir su impacto real, alinear la política hacia una visión de largo plazo basada en evidencia y comunicar con honestidad y transparencia, el sector no solo se protege contra futuras crisis sino que construye una oferta más valiosa, responsable y deseable.
Una sociedad que valore la curiosidad desinteresada tanto como la utilidad práctica; que confíe en los expertos pero fomente el escepticismo informado; y que utilice el poder de la narrativa para iluminar la verdad, no para ocultarla. Dar lugar a la ciencia básica no es un gasto superfluo; es la inversión más crucial que podemos hacer en nuestro futuro colectivo. Es la semilla de la que brotarán las soluciones a los problemas que aún ni siquiera podemos imaginar. En la unión inseparable de lo que es, lo que debe ser y lo que se percibe que puede ser, reside la clave para trascender nuestras limitaciones presentes y medir nuestro progreso hacia un mañana mejor.
Referencias Bibliográficas
Callon, M. (1999). The Role of Lay People in the Production and Dissemination of Scientific Knowledge. Science, Technology and Society, *4*(1), 81–94. https://doi.org/10.1177/097172189900400106
Fischhoff, B., & Scheufele, D. A. (2013). The Science of Science Communication. Proceedings of the National Academy of Sciences, *110*(Supplement 3), 14031-14032. https://doi.org/10.1073/pnas.1312080110
Greenberg, D. S. (2015). The Politics of Pure Science. University of Chicago Press.
Ivars-Baidal, J. A., Celdrán-Bernabeu, M. A., Mazón, J. N., & Perles-Ivars, Á. F. (2019). Smart destinations and the evolution of ICTs: a new scenario for destination management? Current Issues in Tourism, *22*(13), 1581-1600. https://doi.org/10.1080/13683500.2017.1388771
Isaacson, W. (2014). The Innovators: How a Group of Hackers, Geniuses, and Geeks Created the Digital Revolution. Simon & Schuster.
Maddox, B. (2003). Rosalind Franklin: The Dark Lady of DNA. HarperCollins.
Mazzucato, M. (2018). The Entrepreneurial State: Debunking Public vs. Private Sector Myths (Revised ed.). Penguin Books.
Oreskes, N. (2019). Why Trust Science?. Princeton University Press.
Pielke, R. A., Jr. (2007). The Honest Broker: Making Sense of Science in Policy and Politics. Cambridge University Press.
Redefining Luxury: The 2025 Playbook for Travel Professionals
Introduction: The New Language of Luxury
For decades, the term “luxury hospitality” conjured static, universally accepted images: marble lobbies, gold-leaf accents, chauffeur-driven Rolls Royces, and impeccably dressed staff delivering formal, yet often impersonal, service. It was a standardized, one-size-fits-all concept of opulence, a global benchmark that varied little from Paris to Singapore. But as we move through 2025, that entire definition has been thoroughly dismantled and rebuilt. The fundamental question, “What is Luxury?” has become the central challenge and the most significant opportunity for every travel professional today. The answer is no longer found in a style guide but in a deep, empathetic understanding of the evolving human desire for meaning, connection, and personal transformation.
The very etymology of the word, originating from terms meaning “excess,” feels almost archaic. Today, luxury is paradoxically defined not by more, but by better. It is the scarce resource of time, perfectly personalized and reclaimed. It is the authenticity of a local connection, not the isolating perfection of a gilded cage. The modern luxury traveler, increasingly from the Millennial and Gen Z cohorts, isn’t just buying a service or a comfortable bed; they are investing in a transformation, a story to tell, and a set of values that align with their own. They are curating a lifestyle, and their travel choices are the most vivid expression of that curation.
This seismic shift is driven by powerful demographic, technological, and psychographic forces converging at once. With younger generations projected to represent the overwhelming majority of luxury purchases by 2030, their priorities are not merely influencing but actively rewriting the industry’s game plan. They value experiences over material things, sustainability and ethical practices over mere showmanship, and seamless, intuitive digital integration that empowers rather than complicates. This blog post will delve into the key trends shaping this exciting new era, from the rise of the “anywhere traveler” and the non-negotiable demand for authenticity to the delicate balance between AI-powered personalization and the irreplaceable human touch. Furthermore, we will crucially translate these macro-trends into the high-stakes, complex world of MICE, providing a clear roadmap for those looking to capture the loyalty of the most valuable travelers in the world.
1: The Changing Face of the Luxury Traveler
The demographics of luxury have undergone a dramatic and permanent explosion. The archetype of the silver-haired, ultra-wealthy retiree leisurely touring the classics of Europe is now just one fragment of a much broader, more vibrant picture. Luxury is no longer an exclusive club defined solely by immense net worth; it is increasingly accessible to a ambitious, experience-driven professional class. A significant and growing portion of the market now includes travelers with substantial disposable income who choose to allocate a larger share of it to high-value travel experiences, prioritizing memories over material goods.
Even more telling than wealth is the profound age shift. The narrative that luxury is the domain of older generations has been completely overturned. The vast majority of the luxury leisure market is now made up of people below the age of 60, with spending on travel peaking among those between 40 and 60 years old. This is a younger, more dynamic, digitally-native, and discerning crowd that approaches luxury with a different set of expectations and values.
This younger cohort is fundamentally driving the industry’s growth. Gen Z, now entering the workforce with considerable influence and an estimated spending power in the hundreds of billions, is particularly impactful. They are not the future; they are the present. This generation prioritizes a holistic set of values: immersive experiences, genuine sustainability, and seamless omni-channel engagement where the lines between digital and physical blur effortlessly. Furthermore, a powerful lingering post-pandemic desire to “make up for lost time” continues to fuel the market. This phenomenon has led nearly half of all travelers to report they are likely to spend more on their next trip, not just on accommodation, but on upgrading every facet of their experience—from flights and dining to exclusive activities and wellness treatments. This isn’t just travel; it’s targeted investment in personal well-being and joy.
2: The Experience Economy and the Quest for Authenticity
If there is one unifying principle defining the new luxury, it is the insatiable demand for a unique and authentic experience. We have fully transitioned from a goods-based economy to an experience economy, where the value is derived not from a product but from the memory and personal growth it fosters. Research consistently shows that a vast majority of Millennial and Gen Z travelers actively seek out novel experiences that their peers have not heard of, driven by a desire to cultivate a unique personal identity and a genuine connection to the places they visit. This move away from the checklist of iconic landmarks towards a more personal, curated journey is the single most important trend for professionals to understand.
This overarching demand has given rise to two powerful and interrelated sub-trends that are actively shaping travel itineraries and destination choices:
The “Anywhere Traveler” and Detour Destinations: Fueled by a growing awareness of and desire to avoid overtourism, a new type of traveler has emerged. Sometimes dubbed the “anywhere traveler,” this individual has the wealth and time to travel nearly anywhere but is discriminating enough not to visit just anywhere. This group has a strong passion for experiences that take them off the traditional travel pathways to less obvious, often secondary destinations. This isn’t just about being different; it’s about sustainability, preserving the integrity of popular destinations, and discovering a more genuine, unfiltered sense of place. Data shows that a significant majority of consumers are now likely to visit a detour destination on their next trip. This has propelled cities like Girona, Spain (a captivating detour from the crowds of Barcelona), Fukuoka, Japan (a culinary and cultural gem beyond Tokyo), and Brescia, Italy (a historic alternative to Milan) into the spotlight. The appeal is a quieter, more crowd-free experience that feels more personal and discovered.
Hyper-Local Authenticity: Beyond the destination itself, authenticity is the new currency within the destination. The modern luxury traveler wants to feel the pulse of a place. This means dining on regionally sourced food at a family-owned trattoria, not just the hotel’s five-star international restaurant. It means drinking locally crafted beer or wine from a nearby vineyard, not just a famous, imported champagne. It means seeking out interactions with local artisans, guides, and residents to understand their culture and way of life. For luxury hospitality brands, this is not a challenge but a tremendous opportunity to make a positive impact. It’s a chance to deeply embed the property within its community by forming meaningful partnerships with local boutique stores, independent tour-guide services, farm-to-table restaurants, and artists. This approach not only enhances the guest experience but also helps ensure these local businesses can thrive throughout the tourist season and beyond, creating a virtuous cycle of sustainable and ethical tourism.
3: The Luxury MICE Evolution: Where Experience Meets Execution
The trends reshaping individual luxury travel are not confined to leisure; they are simultaneously and powerfully transforming the Meetings, Incentives, Conferences, and Exhibitions (MICE) industry. The era of the traditional, stuffy conference—held in a generic, windowless hotel ballroom with bad coffee and fluorescent lighting—is decisively over. The modern luxury meeting attendee is, first and foremost, an “anywhere traveler” in a professional context. They bring the same expectations for authenticity, wellness, personalized service, and unique experiences from their vacations into their business trips. Companies investing significant sums in high-end meetings and incentives are now looking for far more than just extensive square footage and high-speed internet. They are now partners in curating environments that foster creativity, well-being, and genuine connection, aligning with their corporate values around employee experience, sustainability, and social responsibility.
The goal for the modern meeting planner is to create an event that feels less like a corporate obligation and more like a curated, transformative journey for every single attendee. It’s about designing an agenda that inspires and energizes, not just one that informs.
Luxury Destinations with World-Class MICE Infrastructure: The most forward-thinking destinations and properties are already leading the charge, seamlessly blending state-of-the-art convention facilities with the authentic, experience-driven amenities today’s delegates crave.
Abu Dhabi, UAE: A prime example of a “detour destination,” Abu Dhabi offers a compelling cultural and sophisticated alternative to Dubai. Beyond the stunning, state-of-the-art Abu Dhabi National Exhibition Centre (ADNEC), the city offers unique team-building experiences like private desert safaris under the stars, curated tours of the breathtaking Louvre Abu Dhabi, and exclusive dining experiences that blend modern luxury with ancient traditions.
Santa Barbara, California, USA: Perfectly embodying the “coolcation” vibe, Santa Barbara provides an idyllic setting for executive retreats and high-level meetings. Its luxury resorts boast significant and flexible meeting spaces, but the real value lies outside the walls: strategy sessions can be followed by private wine tastings in sun-drenched vineyards, and leadership workshops can be complemented by mindfulness sessions on a pristine Pacific beach.
Fukuoka, Japan: For groups seeking a distinct cultural and culinary alternative to Tokyo, Fukuoka is a revelation. Its modern conference centers are complemented by the city’s vibrant energy. Delegates can experience authentic team-building through hands-on ramen-making classes, explore ancient temples and shrines, and unwind in traditional onsens (hot springs), offering a perfect blend of business and deep cultural immersion.
The Evolved Role of the Planner: For meeting planners, this new paradigm demands a fundamental shift in identity, from logistics manager to experience architect. This elevated role involves:
Strategic Venue Selection: Choosing properties and destinations that offer a true sense of place and opportunities for local immersion, not just the most convenient or largest space.
Curated F&B Experiences: Moving entirely away from standard banquet meals towards hyper-local, sustainable, and health-conscious culinary journeys. Think chef’s tables featuring local ingredients, interactive food stations, and menus that tell a story about the destination.
Agenda Weaving: Intentionally designing the agenda to weave in “local authentic experiences.” This could be a private after-hours tour of a world-class museum, a masterclass with a local artisan (e.g., a calligrapher in Japan, a leather worker in Italy), or a wellness session like sunrise yoga in a stunning natural setting.
Technology for Personalization: Using event apps and data not just for schedules and logistics, but to offer personalized activity recommendations to attendees during their downtime, effectively acting as a digital concierge that enhances the human touch.
4: The Technology-Humanity Balance
In the new luxury landscape, technology is the great enabler, the invisible engine that powers seamless experiences. However, it is crucial to understand that it is not the goal itself. The ultimate objective remains the creation of unforgettable human moments. The key to success in 2025 and beyond is the masterful fusion of cutting-edge innovation with the timeless, intuitive warmth of the human touch.
Today’s travelers, regardless of age, expect a baseline of seamless digital integration. This includes frictionless mobile check-in and check-out, digital key access, high-speed Wi-Fi as a standard utility, and mobile payment options. Behind the scenes, Artificial Intelligence and data analytics power hyper-personalization, analyzing guest preferences to tailor everything from room temperature and lighting to meal recommendations and activity suggestions before the guest even asks.
However, the consensus among forward-thinking industry leaders is unequivocal: technology must serve to support, never to replace, human connection. Its highest purpose is to automate mundane, administrative tasks freeing staff from behind desks and computer screens to provide the intricate, personal touches that truly define luxury. It’s about using a mobile app to handle a simple room service order so that the concierge has more time to secure that impossible reservation at the city’s most sought-after restaurant. The ultimate luxury, therefore, is choice. The winning strategy is to provide guests with the complete power to choose their own adventure: a fully digital, contactless journey for some, or a richly personal, high-touch interaction for others. This flexibility is paramount for MICE events, where a single group will contain hundreds of individuals with vastly different preferences and comfort levels.
5: The Mainstreaming of Luxury Wellness and Culinary Travel
Wellness has undergone a radical transformation. It has shed its image as a mere spa amenity—a side option for a massage or facial, to become a central, primary motivator for travel itself. A significant majority of travelers now explicitly plan vacations around improving their physical, mental, and emotional well-being. This represents a colossal market opportunity, as these wellness tourists demonstrably spend far more than the average guest, investing heavily in experiences that enhance their quality of life.
Luxury properties are responding with incredibly sophisticated, integrated wellness programs that extend far beyond the spa wall. This includes offering personalized wellness assessments, sleep programs with high-tech sleep tracking, guided meditation and mindfulness sessions, fitness classes with celebrity trainers, and a range of advanced treatments from cryotherapy to IV vitamin drips. Similarly, the concept of culinary travel has also evolved beyond mere indulgence. While fantastic food remains paramount, the focus has expanded to embrace health, sustainability, and hyper-personalization. Travelers want to understand the provenance of their food, support sustainable farming practices, and enjoy meals that are both delicious and nourishing. Menus are increasingly designed by nutritionists, and AI is being explored to create hyper-personalized diets based on a guest’s specific physiological needs and goals, truly marrying the culinary and wellness trends into a holistic health experience.
Conclusion: The Ever-Evolving Definition of Luxury
Luxury in 2025 is dynamic, deeply personal, and profoundly human. It has been stripped down from its old definitions of opulence and rebuilt around the core tenets of connection, authenticity, and personalized care. It is defined not by the thread count of the sheets or the sparkle of the chandeliers, but by the genuine warmth of a welcome, the thrill of a unique discovery, and the feeling of being truly understood and cared for as an individual.
For travel professionals, the agents, hoteliers, tour operators, and meeting planners, the mandate is clear and exciting. We can no longer be mere service providers; we must become curators of experience, masters of data-driven personalization, and authentic champions of our local communities. We must embrace technology as a powerful tool to elevate operational efficiency, but we must never, ever lose sight of the fact that we are, at our heart, in the business of human connection and creating joy.
The future of luxury hospitality belongs to those who can perfectly balance the two: leveraging the power of AI to recommend a hidden-gem restaurant while simultaneously empowering a concierge to secure that impossible reservation. It belongs to those who use digital platforms to streamline operations so that staff have more time, not less, to deliver the warm, intuitive, and memorable service that creates lasting loyalty. In this new era, true luxury is the perfect, seamless, and almost magical blend of the extraordinary and the authentic. It is our privilege to provide it.
References
American Express. (2023). 2023 Global Travel Trends Report.
Calin, L. (2025). [Quote on technology and choice]. Hospitality Net.
FINN Partners. (2025). The Future of Culinary Travel Report.
Global Wellness Institute. (2025). Global Wellness Economy Monitor.
Johnson, P. (2025). [Quote on coolcationing and overtourism]. A Luxury Travel Blog.
Johnston, I. (2025). [Quote on Gen Z, Millennials, and technology]. Interview.
McKinsey & Company. (2025). The State of Luxury Travel.
Mogelonsky, L. (2025). [Quote on the definition of luxury and authenticity]. Hotelier Magazine.
Skift. (2025). The Experience-Seeker Traveler Report.