
Destination Intelligence: The New Economics of Tourism

From Visitor Volume to Value, Resource Productivity and Resilience

By Jorge Zárate

English publication version

For decades, much of international tourism policy was built around a simple idea: attract more visitors. More tourists meant more flights, more occupied hotel rooms, more restaurant business, higher consumption and, consequently, greater economic impact. Tourism boards promoted destinations; airlines transported passengers; hotels provided accommodation; and governments counted arrivals.

That model helped develop some of the world’s most successful tourism destinations. But it is no longer enough. Geopolitical conflicts can now alter air routes and energy costs within days; climate change affects water availability, wildfires, temperatures, infrastructure and insurance; housing pressure is forcing destinations to reconsider the relationship between tourism and residents; and artificial intelligence allows demand, pricing, mobility and behavior to be analyzed at a speed that was previously impossible.

Artificial intelligence is accelerating this transition. But its most important contribution to tourism may not be generating more content, images or advertising. Its greater value lies in helping destinations recognize patterns that are difficult to see manually: changes in demand, source-market behavior, price sensitivity, air-connectivity risk, resource consumption, visitor conversion and emerging pressure on infrastructure.

Combined with data science, econometrics and forecasting, AI can help transform fragmented tourism data into decision intelligence. The question is no longer simply what happened last month. Increasingly, destinations need to understand why it happened, what is likely to happen next, and which management decision could produce the best economic, environmental and social outcome.

Sustainability has also moved from the margins to the center of destination economics. According to the World Travel & Tourism Council (WTTC), Travel & Tourism accounted for 7.3% of global greenhouse-gas emissions in 2024, down from 8.3% in 2019. More importantly, the sector’s emissions intensity — emissions generated per unit of economic contribution — fell 15% between 2019 and 2024. This shows that tourism can generate more economic value with relatively less carbon, although absolute emissions must also continue to decline.

UN Tourism is moving in the same direction through frameworks that integrate the economic, environmental and social dimensions of tourism. Its ESG work explicitly includes greenhouse-gas emissions, water use, energy, waste and recycling. The principle is straightforward: if we do not measure the resources we use and the impacts we create, we cannot know whether we are actually improving.

The conclusion is fundamental: a destination can no longer be managed only as a tourism product. It must be managed as an economic, environmental, territorial and data system. That requires changing both how destinations plan and how they promote themselves.

This is the new economics of tourism: not maximizing one indicator, but continuously optimizing the relationship between demand, value, resources, connectivity, residents and risk.

1. From More Tourists to More Value per Visitor

The first transformation must take place in the indicators used to define success. If a destination received 10 million visitors last year and 10.5 million this year, the traditional headline would be 5% growth. But that number alone tells us very little.

What happened to spending? Did average length of stay increase? Did occupancy improve during the low season? How much additional water was required? How much waste did those visitors generate? How much did energy consumption increase? What happened to housing costs? How many permanent jobs were created? How much CO₂e was produced? And how much of every peso, dollar or euro spent actually remained in the local economy?

The objective should evolve from Visitor Volume toward Visitor Value + Resource Productivity + Resident Value. A destination can even receive fewer tourists and achieve a better economic outcome if it increases length of stay, visitor spending, shoulder-season occupancy and the geographic distribution of consumption.

Arrivals should therefore continue to be measured, but they should no longer be the principal measure of success. The executive question should become: how much net value does tourism generate per visitor, per night and per unit of resource consumed?

2. Sustainability in Plain Language: Use Fewer Resources to Create More Value

Sustainability is often explained in technical language that makes it sound more complicated than it is. A simpler way to understand it is to imagine a tourism destination as a very large house that receives guests every day. To look after those guests, the house needs water, electricity, food, transportation and materials. It also produces waste and emissions. If the house receives more guests every year but wastes more water, energy and food, it may look successful while its costs and problems are also growing.

The goal should not be only to receive more people. It should be to serve them better while using fewer resources for each visit. That is resource productivity.

Here is an easy example. Imagine a destination generates US$5 billion in tourism revenue and uses 30 million cubic meters of water. Divide US$5 billion by 30 million cubic meters and the result is about US$166.7 of tourism revenue for every cubic meter of water used.

Now imagine that a few years later the destination generates US$6.5 billion while still using the same 30 million cubic meters of water. Each cubic meter now helps produce about US$216.7. In simple terms, the destination is creating much more economic value with the same amount of water. Water productivity has improved by roughly 30%.
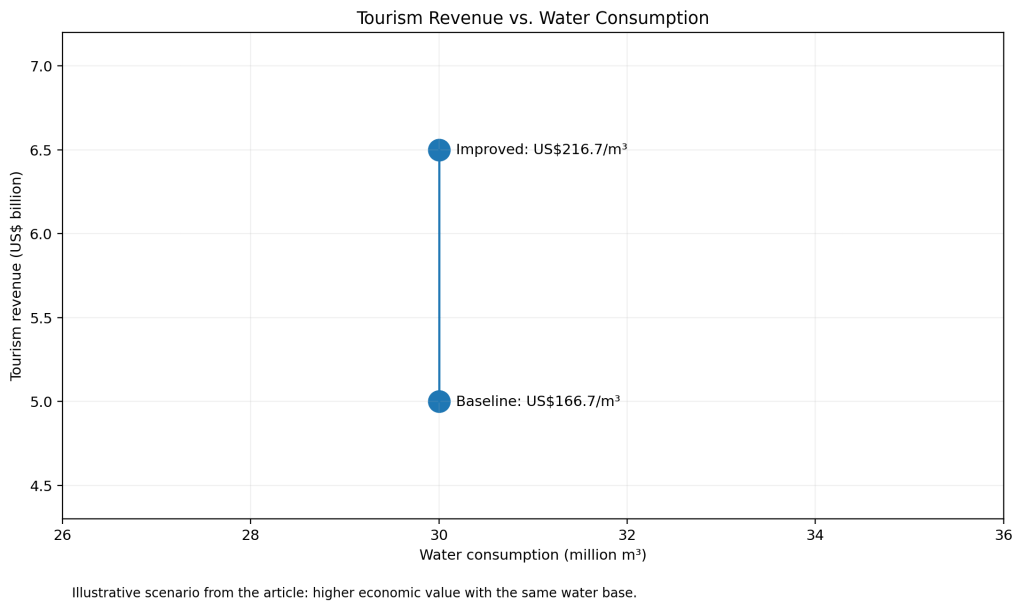
This does not mean US$216.7 is a universal target, nor that water is the only important resource. It is simply a way to understand the logic: measure how much economic value we obtain from every unit of water, energy, material or carbon used. Every destination should establish its own baseline and improve it over time.

The same logic applies to electricity. Suppose a group of hotels used 100 million kWh to support a certain level of tourism activity and later manages to produce more room nights and revenue while using 90 million kWh. It has saved 10 million kWh. If electricity costs US$0.15 per kWh, that represents US$1.5 million in lower energy expenditure. The story should always connect three things: resources saved, money saved and emissions avoided.

This is why sustainability should not automatically be presented as an additional cost. When managed properly, it can mean lower operating expenses, less exposure to resource scarcity, more efficient assets and a more competitive destination.

3. Circular Economy and Recycling: Stop Throwing Value Away

The circular economy can also be explained simply. The traditional model is: buy, use and throw away. A circular model asks a different question: before we throw something away, can we avoid buying it, use it again, repair it, transform it, recover its materials or recycle it?

Think about a hotel, restaurant or convention center. Every day, food, bottles, cans, cardboard, textiles, cleaning products and many other materials enter the operation. If everything ends up mixed in one waste container, the destination pays to buy those materials and then pays again to dispose of them. That is a double loss.

A destination should therefore measure, at a minimum, total tonnes of waste, kilograms of waste per guest night, the percentage prevented, reused, composted or recycled, and the percentage sent to landfill. Food waste per guest and per event should also be measured.

Suppose hotels, restaurants and events divert 5,000 tonnes of waste that previously went to landfill. If landfill disposal costs US$60 per tonne, the destination avoids US$300,000 in disposal costs. If separated materials such as cardboard, aluminum and glass generate another US$120,000 in recovered value, the total economic benefit associated with the program would be US$420,000.

Again, this is an illustrative example, not a universal figure. Each destination must use its actual costs. The important point is that “we recycled 5,000 tonnes” should not be the end of the story. The complete explanation is: we kept 5,000 tonnes out of landfill, avoided X in disposal costs, recovered Y in material value and reduced Z tonnes of CO₂e where that reduction can be credibly calculated.

Circularity should also extend to procurement. What percentage of food comes from local producers? How many suppliers use returnable packaging? How much furniture is repaired instead of replaced? What percentage of treated water is reused? Circular economy is not simply recycling; it is designing the system so that less waste is created in the first place.

4. CO₂: Avoid First, Reduce Next, Compensate Last

Another concept that should be communicated clearly is the difference between reducing emissions and simply offsetting them. If a hotel room leaves lights and air conditioning running unnecessarily, buying an offset afterward does not correct the original waste. The first logical action is to avoid that unnecessary consumption.

A simple hierarchy is: Avoid → Reduce → Replace → Recover → Compensate. First avoid what is unnecessary. Then reduce what is genuinely needed. Next replace technologies or energy sources with lower-carbon alternatives. Recover materials or energy whenever possible. Only after those steps should residual emissions that cannot yet be eliminated be compensated.

Imagine several hotels used 50 million kWh per year and, through insulation, efficient equipment, sensors and better operations, reduce consumption by 8 million kWh. If the electricity avoided corresponds — using the applicable emissions factor — to 3,200 tonnes of CO₂e, those are emissions avoided against the baseline. At US$0.15 per kWh, the operating saving would also be US$1.2 million.

These are teaching numbers used to show the method. A real project must use measured consumption, actual tariffs and official emissions factors. The KPI should not be a vague statement such as “we are carbon neutral,” but verifiable indicators: total tCO₂e, kg CO₂e per visitor-night, tCO₂e avoided versus baseline and the share of lower-carbon energy.

WTTC reports that transportation accounted for 40% of Travel & Tourism greenhouse-gas emissions in 2024, while utilities represented 19%. This is an important reminder that destination decarbonization cannot stop at the hotel door: air connectivity, ground mobility, energy systems and urban design are part of the same equation.

5. Water: Turn Every Liter into a Management Indicator

For many destinations — particularly islands, coastal areas and water-stressed regions — water will become one of the most important tourism KPIs of the future. The simplest explanation is this: it is not enough to know how much water the entire city used. We need to know how much water was required for each tourism night and whether that number is improving.

Suppose the baseline is 450 liters per guest per night. After improving showers, fixing leaks, changing laundry practices, optimizing irrigation and reusing water, consumption falls to 360 liters. That is 90 liters less per guest-night, a 20% reduction.

If the destination records 10 million guest nights a year, 90 liters multiplied by 10 million equals 900 million liters that no longer need to be consumed. That is 900,000 cubic meters. The percentage suddenly becomes tangible: we are talking about almost one billion liters of water avoided.

Then comes the economic question. If capturing, treating, pumping and processing one cubic meter costs US$2 in total, those 900,000 cubic meters would represent US$1.8 million in avoided cost. If the destination’s real cost is different, simply replace the number in the formula.

Useful KPIs include liters per guest-night, cubic meters per US$1,000 of tourism revenue, percentage of wastewater treated, percentage of treated water reused, percentage of landscaping irrigated with reclaimed water and water cost per occupied room. The purpose is not to fill reports with numbers. It is to identify where a critical resource is being wasted and how much that waste costs.

6. Air Connectivity Must Be Managed as a Portfolio

Recent events continue to demonstrate the fragility of connectivity. Wars, airspace closures, fuel prices, airline partnerships, fleet changes and operating restrictions can quickly alter a destination’s competitiveness.

A DMO should therefore go beyond celebrating “we secured a new route.” The better question is: what incremental economic value does this route create, and what risk does it reduce or increase? For every source market, destinations should follow an analytical chain: Demand → Seats → Frequency → Fare → Conversion → Length of Stay → Spend → Seasonality → Economic Value.

Carbon intensity can also be incorporated into mobility analysis when a consistent methodology is available. This does not mean rejecting long-haul markets. It means understanding the trade-off between economic value, connectivity and externalities.

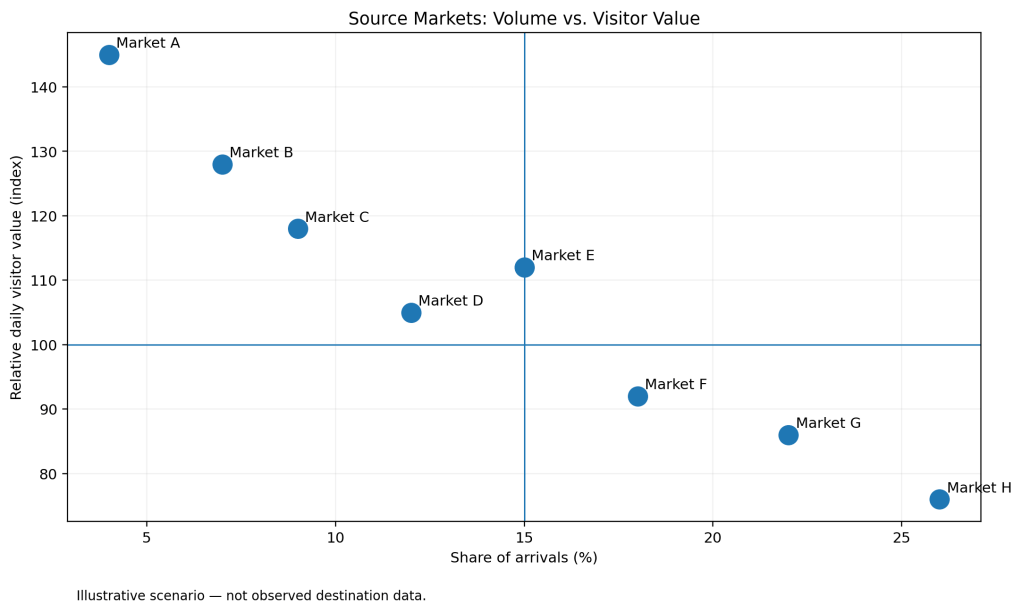
A destination may discover that one source market represents only 5% of arrivals but generates 35% more daily spending, 1.8 additional nights of stay and demand during low-occupancy months. That market may be far more strategic than a high-volume market with low spending and extreme seasonal concentration.
7. Tourism Promotion: The Event Can No Longer Be the Final Product

This is where the model needs to change radically. A tourism board attends FITUR, ITB, WTM or a commercial roadshow. It invites tour operators, travel agents, airlines and media. It shows a video, talks about the destination, distributes information, takes photographs and posts on social media. Then the event ends. Too often, the market intelligence ends there as well.

That model wastes information. An event should become a mechanism for data acquisition and commercial development, not merely exposure.

Before the event, there should be an information architecture. With consent and in compliance with applicable privacy rules, participants can provide relevant information such as market, company, segment, approximate volume, destinations sold, seasonality, customer profile, product interest, commercial intent and decision horizon.

During the event, QR codes, microsites, short surveys, digital agendas and interactive content can reveal which products generate interest. The objective is not to surveil the audience; it is to create useful interactions in exchange for voluntary and relevant information.

After the event, the most important phase begins: follow-up. Who requested information? Who opened the proposal? Which operator showed an intention to program the destination? How many meetings produced opportunities? How many opportunities became passengers, room nights and spending?

8. From CRM to Destination Intelligence CRM

A DMO should build a genuine market-intelligence database, not simply an email list. Every contact can become a structured observation: Who → Market → Segment → Interest → Interaction → Intent → Follow-up → Conversion → Value.

For example: Operator A; Spain; Luxury; interest in wellness; potential volume 1,200 passengers; travel period October–March; meeting held at FITUR; proposal sent; final result 450 passengers; 2,700 room nights; €540,000 in attributable revenue, provided the attribution methodology can support that claim.

The trade show is no longer reported as “we participated in an event.” It becomes investment → qualified leads → opportunities → conversions → room nights → economic impact. This allows destinations to compare events, markets and campaigns and decide where the next promotional peso, dollar or euro should be invested.

9. The Audience Should Participate, Not Just Receive Advertising

Modern promotion should move partly away from one-way communication. Publishing “visit our destination” is not enough. Digital interactions should also be designed to learn from the consumer.

Short surveys, quizzes, itinerary builders, inspiration tools, preference selections and personalized content can help identify what a traveler is looking for: gastronomy, culture, nature, luxury, wellness, events, family travel, adventure or sustainability; when they intend to travel; where they live; how many days they expect to stay; their approximate budget; and what type of experience they prefer.

The objective is not indiscriminate data collection. It is to obtain consented, useful and proportionate first-party data, with clear rules for privacy, retention and use. Every data point should have a business reason.

Then comes analysis: which segments convert best, which spend more, which travel outside peak season, which content creates genuine intent and which product combinations increase length of stay.

10. From Engagement to the Conversion Funnel

Likes, followers and impressions help measure reach, but they should not be the end of the analysis. Tourism promotion needs a funnel: Reach → Engagement → Qualified Interest → Lead → Booking Intent → Conversion → Stay → Spend → Return/Advocacy.

KPIs should include cost per qualified lead, lead-to-booking conversion, cost per incremental visitor, incremental room nights, incremental tourism revenue, average spend, length of stay, repeat visitation and campaign ROI.

There is also a harder question: did the visitor travel because of the campaign, or would that person have traveled anyway? That is incrementality. A/B testing, control markets, geographic experiments and econometric models can provide a much better approximation of the answer.

Promotion then stops being an isolated creative activity and becomes a commercial learning process. Every campaign should produce Brand Value + Commercial Value + Data Value.

11. Build a Tourism Data Exchange

Tourism data is usually fragmented. Hotels know some things; airports know others; airlines, OTAs, attractions, payment companies, telecommunications providers and governments hold other pieces of the story. The destination sees fragments but rarely the complete system.

The opportunity is to create, while respecting privacy, contracts and regulation, a Destination Tourism Data Exchange that integrates aggregated and anonymized information. This does not mean centralizing all personal data. It means agreeing on standards and mechanisms through which each participant can contribute to a common view without losing inappropriate control over its information.

Europe offers a useful reference for the direction of travel. The European Commission’s EU Tourism Dashboard currently contains 35 indicators and descriptors organized around the green, digital and socio-economic transitions, plus basic destination descriptors; some indicators are now available at municipal level.

An advanced destination should aim to combine official statistics with higher-frequency market signals: searches, airline capacity, fares, bookings, occupancy, mobility, aggregated spending, climate, water, energy and resident sentiment.

12. AI and Data Science: From Information to Decision Intelligence

A DMO does not primarily need artificial intelligence to write social-media captions. It needs AI and data science to answer economic questions: what will demand look like six months from now? Which market has the highest probability of conversion? Which routes are losing competitiveness? Which segments are most price-sensitive? Which campaign creates incremental visitors? Which areas are approaching critical capacity?

This is where time-series forecasting, regression, clustering, propensity models, price elasticity, anomaly detection, scenario simulation and geospatial analytics become useful. More complex models should only be used when they improve a decision; complexity is not the same as quality.

AI must move from content generation to decision intelligence. Every application should have a business case: implementation cost, expected savings, incremental revenue, model accuracy, risk and payback period.

The real opportunity begins when AI is connected to the destination’s own operating and market data. Historical arrivals, hotel performance, air capacity, fares, source markets, visitor spending, seasonality, campaign response, mobility, water, energy and other indicators can become part of an analytical environment designed to identify relationships and anticipate change.

The objective is not to ask AI to make the decision. It is to improve the evidence available to the people responsible for making it.

Where AI Can Create Practical Destination Value

Demand Forecasting. Machine-learning and time-series models can help estimate future demand by source market, season and segment, allowing destinations and tourism businesses to anticipate changes rather than simply report them afterward.

Source-Market Intelligence. AI can help identify patterns across spending, length of stay, seasonality, conversion and connectivity to determine which markets may generate greater strategic value — not necessarily which markets generate the largest number of arrivals.

Resource Optimization. Tourism activity can be analyzed alongside water, energy, waste and infrastructure indicators to identify inefficiencies, forecast resource pressure and test whether economic value is growing faster than resource consumption.

Commercial Intelligence. Campaign, CRM and conversion data can be analyzed to identify which audiences, markets, partners and promotional investments are associated with measurable economic outcomes. Where the data permit it, experimental and econometric methods should be used to distinguish correlation from incremental impact.

Risk and Resilience. AI-supported scenario analysis can help destinations explore the potential effects of changes in airline capacity, source-market demand, climate conditions, resource constraints or other external shocks.

AI, however, does not eliminate the need for statistical discipline. A model can discover patterns that are commercially interesting and still confuse correlation with causation. For that reason, Destination Intelligence should combine machine learning with econometrics, statistical testing and domain expertise. Forecast accuracy, model stability, explainability and business relevance matter more than technological sophistication for its own sake.

The analytical progression can therefore be expressed simply:

Destination Data → Data Science & AI → Decision Intelligence → Strategy → Measurable Value

Technology is not the final product. Better decisions are.

13. A New Destination KPI Framework

If we were designing a destination management dashboard for the next decade, it should combine demand, economic value, sustainability, community, promotion and resilience. No single KPI can explain the whole system; the advantage comes from connecting them.

The next step is not simply to place these indicators on the same dashboard. It is to analyze how they interact. This is where statistical analysis, econometrics and AI become particularly valuable. They can help identify relationships between source markets, connectivity, length of stay, spending, seasonality, resource intensity, resident value and resilience — relationships that may be difficult to recognize when each KPI is managed separately.
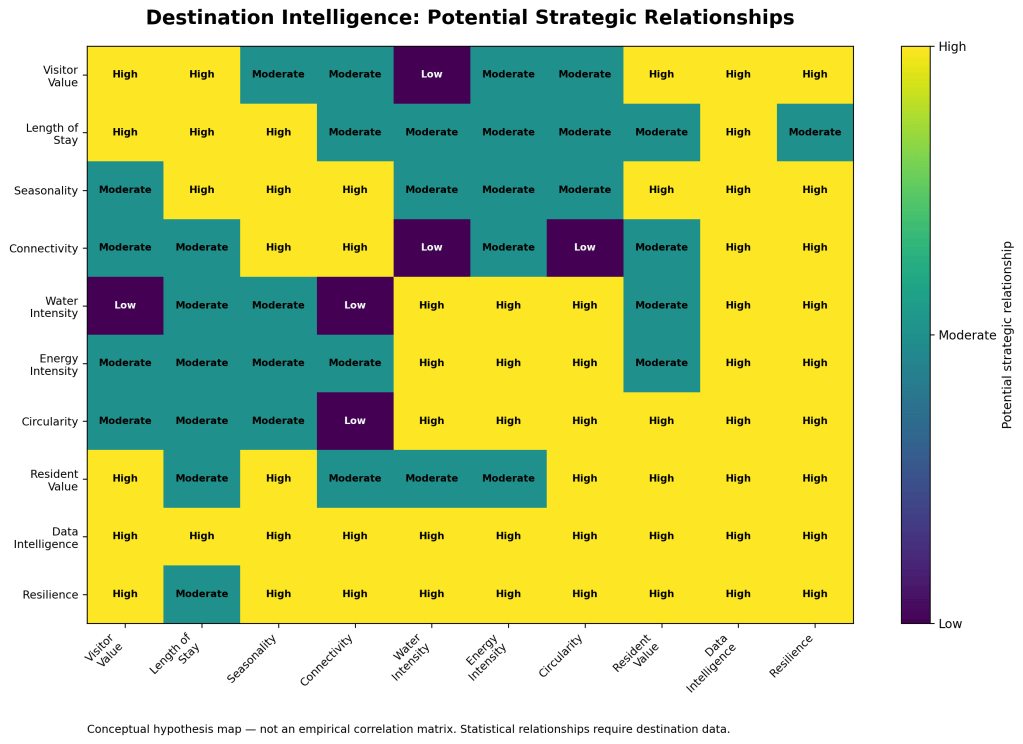
The heatmap above is deliberately conceptual. It does not present observed correlations. In a real Destination Intelligence project, these hypotheses would be tested using the destination’s own data through correlation analysis, regression, time-series methods, machine learning and other appropriate techniques.

14. The Destination Resilience Dashboard

All of these data should feed an integrated executive dashboard — not an annual report published six months after the fact, but a decision system capable of detecting change and supporting action.

It can be organized into seven layers: Demand; Value; Connectivity; Environment & Circularity; Community; Commercial Intelligence; and Risk & Resilience. Above all seven should sit Forecast + Scenario Modeling.

The dashboard should answer four questions: What happened? Why did it happen? What is likely to happen next? What should we do? That is the difference between accumulating statistics and producing intelligence.

15. Sustainability Must Also Become Part of Promotion

There is an opportunity that many destinations still underuse: communicate sustainability through results rather than adjectives. “We are sustainable” says very little. “We reduced water use per guest-night by 18% from our verified baseline” says exactly what changed.

A destination can communicate, when the figures are verified, water intensity, energy intensity, share of lower-carbon energy, tonnes of waste avoided, landfill-diversion rate, food waste reduced, tonnes of CO₂e avoided and the economic savings associated with those improvements.

The key is to tell the complete story. For example: “We use 90 fewer liters of water per guest-night; across 10 million nights, that equals 900 million liters avoided.” A 13-year-old can understand it. An investor can understand it too. Then add the actual financial saving and methodology.

Sustainability then stops being a moral obligation presented to the traveler and becomes transparency, efficiency and participation. Visitors can even be invited to choose public transport, local products, shoulder-season experiences or verified high-performing businesses, while destinations measure which options produce the strongest response.

16. The Promotion of the Future Will Be a Continuous Conversation

The major transformation is from isolated campaigns to continuous relationships. The traditional cycle was Campaign → Visitor → End. The new cycle should be Discover → Engage → Learn → Personalize → Convert → Measure → Retain → Learn Again.

Every interaction produces information. Every trip produces data. Every campaign creates an experiment. Every season allows the models to be recalibrated. The destination begins to learn — and the more it learns, the better it can allocate budget, capacity, infrastructure and resources.

A campaign can be copied. A video can be copied. A slogan can be copied. A knowledge base built over years around behavior, demand, connectivity, sustainability and conversion is much harder to copy. It can become one of a DMO’s most valuable assets.

Conclusion: From Destination Marketing to Destination Intelligence

Tourism is entering a different stage. Success should no longer be defined by another annual visitor record. The real question is: are we generating more value while using resources more efficiently and increasing the destination’s resilience at the same time?

That requires integrating economics, aviation, technology, sustainability, circular economy, infrastructure, housing, mobility and community. It also requires abandoning the idea that sustainability means only reducing environmental impact.

Properly managed sustainability means less energy and lower cost; less water and greater resilience; less waste and higher productivity; more recycling and reuse and lower resource dependency; less CO₂e and lower climate and regulatory exposure; more local procurement and greater economic retention; and better information for better decisions.

Promotion must evolve as well. It is no longer enough to attend a trade show, organize an event, buy a campaign, produce a video and count attendees. Every promotional action should produce three outcomes: Brand Value + Commercial Value + Data Value. If it produces only visibility, much of its potential is being wasted.

The destination of the future will use every interaction to understand its market better, every campaign to experiment, every event to generate commercial intelligence and every visitor to understand the relationship between revenue and resources.

The conceptual evolution is therefore: Destination Marketing → Destination Management → Destination Intelligence.

And the new equation for success is: Visitor Value + Resource Productivity + Resident Value + Data Intelligence = Destination Resilience.

The competitive destination of the future will not necessarily be the one receiving the most tourists. It will be the one capable of identifying which visitors create the greatest value, attracting them at the right time, measuring how much they truly leave in the local economy, managing water, energy and materials efficiently, reducing emissions and waste, protecting its community, turning promotion into information and using that information to predict what it should do next.

We do not simply need destinations that are promoted more aggressively. We need destinations that learn, measure, optimize and regenerate. When tourism, circular economy, data science, connectivity and investment are managed within the same model, sustainability stops looking like an additional cost. It becomes productivity, competitiveness and economic value.

DimensionPriority KPIManagement question
DemandArrivals, room nights, LOSHow much demand and how many nights are we generating?
Economic ValueSpend/visitor, ADR, RevPAR, tourism revenueHow much economic value does demand create?
SeasonalityMonthly demand concentrationHow dependent are we on a few peak months?
ConnectivitySeats, routes, frequency, faresHow accessible and diversified is the destination?
Carbonkg CO₂e/visitor-night; tCO₂e avoidedHow much carbon does activity generate, and how much do we avoid?
EnergykWh/guest-night; low-carbon energy shareAre we using less energy and cleaner energy?
Waterliters/guest-night; m³ avoided/reusedHow much water is required for each tourism night?
Circularitywaste/guest-night; diversion & recycling rateHow much waste do we prevent and recover?
Foodfood waste/guest-nightHow much food ends up being wasted?
Local Economy% procurement from local suppliersHow much tourism spending remains locally?
Communityhousing pressure, wages, resident sentimentDoes tourism improve or weaken local quality of life?
Mobilitypublic/low-carbon visitor transport shareHow do visitors move within the destination?
Marketingqualified leads, conversion, CACDoes promotion create intent and customers?
Commercialcampaign-attributable room nights/revenueWhat value can be attributed to commercial investment?
Resilienceclimate, connectivity & source-market concentrationHow vulnerable is the destination to shocks?
Data% ecosystem providing usable dataHow complete is our decision-making capability?
Methodological note on figures and calculations

Figures attributed to external organizations are presented as documented evidence and are supported by the APA 7 references listed at the end of the article.

Examples such as 450 to 360 liters per guest-night, US$60 per tonne of waste, US$0.15 per kWh, 5,000 tonnes diverted from landfill and similar exercises are teaching examples created to explain how the KPIs work. They are not observed results from a specific destination.

When a figure is produced through arithmetic from an illustrative scenario — for example, 90 liters × 10 million guest nights = 900 million liters — it should be understood as an illustrative author calculation. In a real application, these values must be replaced with verified baselines, actual tariffs, official emissions factors and destination operating data.

This distinction separates clearly: (1) documented external evidence, (2) derived calculations and (3) teaching scenarios.

References

European Commission, Directorate-General for Mobility and Transport. (2025, December 15). Updated facts and figures on EU tourism available now. European Commission. https://transport.ec.europa.eu/news-events/news/updated-facts-and-figures-eu-tourism-available-now-2025-12-15_en

European Parliament & Council of the European Union. (2024). Regulation (EU) 2024/1028 of 11 April 2024 on data collection and sharing relating to short-term accommodation rental services. EUR-Lex. https://eur-lex.europa.eu/legal-content/EN/TXT/?uri=CELEX:32024R1028

UN Tourism. (n.d.). ESG framework for tourism businesses. UN Tourism. https://www.unwto.org/es/estadisticas-turismo/esg-empresas-turisticas

World Travel & Tourism Council. (n.d.). Environmental & Social Research (ESR). WTTC. https://wttc.org/research/environmental-social

APIs and Microservices in Tourism: The Digital Architecture Connecting Destinations

By Jorge Zárate

A tourism ecosystem connected through APIs across airports, hotels, transport, culture and destination services.

Executive summary

Digital transformation in a destination is not simply the launch of an app or the installation of sensors. Real transformation occurs when hotels, attractions, mobility providers, businesses, public agencies and visitors can exchange information and coordinate services securely. APIs make that communication possible. Microservices, when scale and complexity justify them, can organize digital capabilities into components that evolve independently.

This study explains both concepts from a destination-management perspective. It places special emphasis on ecosystem participation, data collection, statistical and predictive analysis, operational efficiency and return on investment. Its central argument is that technology creates value only when it connects organizations, data and decisions under trusted governance.

1. The challenge is not another app, but a connected destination

A tourism destination operates as a network. Hotels, restaurants, airlines, airports, agencies, museums, guides, transport companies, event organizers, retailers and public authorities use different systems and pursue different objectives. This diversity creates value, but it also produces fragmentation.

Many integrations still depend on emailed files, spreadsheets or custom interfaces. The result is duplicated work, outdated information and an incomplete view of demand. A destination app may look modern while relying on manual processes behind the screen.

APIs and microservices address different parts of this problem. An API defines how two systems exchange information. A microservices architecture divides selected capabilities into services that can evolve with greater autonomy. They are not synonyms, and a destination does not need to adopt both everywhere.

The strategic question is therefore not “Do we need microservices?” It is “Which capabilities must be connected, which data should be shared, and which measurable outcomes should improve?”

2. Essential concepts

2.1. What is an API?

An application programming interface, or API, is a digital contract. It defines what information or function a system offers, how another system can request it, the expected response and the required permissions.

A hotel can use an API to publish room availability and rates without giving an external platform direct access to its internal database. A transport authority can expose schedules, incidents and vehicle positions so that several applications can reuse the same information.

APIs are commonly classified as internal, partner or public. REST is widely used for HTTP-based interfaces; GraphQL and gRPC serve different requirements. JSON is common in modern applications, while XML remains relevant in travel standards and legacy systems.

A managed API requires documentation, versioning, authentication, authorization, usage limits, monitoring and data-quality rules. OpenAPI provides a standard description for HTTP APIs. OAuth 2.0 enables limited access without requiring users to share their credentials directly.

2.2. What are microservices?

In a monolithic application, several functions are developed and deployed as one unit. This can be an effective model for a small product or a limited team. Difficulties arise when the system becomes too large, internal dependencies become unclear, and every change requires broad coordination.

A microservices architecture organizes a platform around relatively independent business capabilities: catalogue, reservations, payments, profiles, notifications, mobility or analytics. Each service may have its own development cycle and scale according to demand.

Autonomy introduces additional network communication, potential failure points, observability requirements and data-consistency challenges. The trade-offs described by Martin Fowler explain why a modular monolith can be the better first stage for many destinations.

2.3. How do APIs and microservices relate?

The API is the interface; a microservice is one possible implementation behind it. A destination can publish APIs over monolithic systems, commercial platforms or legacy databases without converting its entire technology estate into microservices.

In a distributed architecture, an API gateway often acts as the entry point. It receives requests, verifies identities and permissions, applies traffic limits, records activity and routes each request. A complete API-management platform also manages the catalogue, lifecycle, policies, analytics and developer portal.

3. What tourism problems can they solve?

Fragmentation

APIs allow organizations with different technologies to collaborate without replacing their internal systems. This is particularly important for small businesses that cannot afford a separate integration with every partner. The SEGITTUR Smart Destinations Platform addresses this need to combine public and private data.

Inconsistent information

Visitors consult websites, mobile applications, information centers, kiosks and external platforms. When those channels reuse shared services, discrepancies in schedules, availability and content can be reduced.

Rapidly changing inventory and operations

Inventory, capacity, traffic and schedules change throughout the day. APIs shorten the distance between an operational event and the channel that uses it. They do not eliminate overbooking or errors on their own; inventory rules, reconciliation and data-quality controls are still required.

Services that ignore context

A destination can combine declared preferences and context to provide useful recommendations. When personal data is involved, purpose limitation, transparency, limited retention and data minimization must apply.

Limited public-private coordination

A shared infrastructure can connect municipal and business information under common rules. The value does not come from centralizing everything, but from defining responsibilities, standards and access conditions that create trust.

4. A connected destination requires the whole ecosystem

API implementation should not be treated as an IT-only or DMO-only project. Its usefulness depends on broad participation by the organizations that produce, manage or use destination information. If the official website and a few large companies are the only participants, the platform provides a partial representation and reproduces the gaps it was meant to close.

Broad participation does not mean that every participant must purchase the same technology. A microbusiness may contribute through a simple form; a hotel may connect its systems through an API; a public agency may publish open data; and a university may support research design and predictive modelling. What matters is that essential data have known owners, definitions and update mechanisms.

4.1. Local government and public agencies

Tourism offices, mobility, culture, safety, environmental and public-service agencies contribute information on events, public works, transport, accessibility, incidents, resource use and territorial conditions. Their participation connects visitor management with residents’ daily lives and prevents tourism from becoming an isolated system.

4.2. Destination management organization

The DMO should coordinate rather than seek to own every dataset. Its responsibilities include setting priorities, convening participants, defining minimum standards, maintaining the API catalogue, measuring results and ensuring that decisions serve public and business objectives. It must also communicate what each participant receives in exchange for contributing information.

4.3. Large and small tourism businesses

Hotels, restaurants, attractions, guides, retailers, operators and event organizers generate vital information on demand, availability and consumption. Larger firms often have systems that support integration. Small firms need low-cost mechanisms, training and immediate benefits such as greater visibility, less manual data entry or access to aggregated market intelligence.

Excluding small enterprises biases the data toward technologically mature actors and may concentrate commercial opportunities. The architecture should support different levels of digital maturity and proportionate onboarding methods.

4.4. Transport, infrastructure and essential services

Airports, terminals, public transport, parking, shared mobility, telecommunications, energy, water and waste services link visitor activity with capacity, cost and sustainability. Their information helps anticipate pressure and allocate people and resources more effectively.

4.5. Residents, visitors, academia and entrepreneurs

Residents and visitors contribute perceptions, satisfaction, accessibility needs and incident reports that transactional systems cannot capture. Universities can design surveys, assess bias and validate models. Startups and developers can transform APIs into new services. Participation should include consultation, privacy rules and feedback on outcomes; the community should not be treated merely as a source of data.

4.6. Trust-based exchange

Every dataset needs a defined purpose, owner, quality rule, update frequency and access condition. Some data can be public; other information should be shared only in aggregate or under agreement. Reporting which decisions were improved by contributed data turns participation into a value exchange rather than an administrative burden.

5. From data collection to measurable decisions

APIs allow data to be captured near the moment an activity occurs and reused without manual re-entry. Accumulation alone, however, is not intelligence. A destination needs a complete chain: collection, validation, integration, analysis, decision, action and measurement.

5.1. Data sources

A tourism-intelligence system can combine six families of data:

  • Transactional: bookings, sales, cancellations, refunds, tickets and destination-card use.
  • Operational: availability, occupancy, capacity, waiting time, incidents, schedules and transport capacity.
  • Digital: website or app searches, clicks, viewed routes and process abandonment, subject to applicable privacy rules.
  • Territorial and sensor data: aggregated mobility, traffic, parking, weather, environmental quality, water, energy and waste.
  • Perception: surveys, reviews, visitor-service contacts, comments and resident participation.
  • Contextual: events, holidays, air connectivity, prices, economic indicators and external conditions affecting demand.

Not all information needs to move in real time. Availability and incidents may require immediate updates; surveys and economic indicators may be integrated daily, monthly or seasonally. Frequency should match the decision that the data support.

5.2. Quality before volume

Definitions, formats, duplicates, missing values, coverage and timeliness must be checked before analysis. Common identifiers are also needed for locations, dates, products and organizations. Without this discipline, a dashboard can display precise-looking figures that are inconsistent in meaning.

Representativeness matters. If only large hotels or app users contribute data, conclusions cannot describe the entire market. Every analysis should document coverage, potential bias and limits of inference.

5.3. Four levels of analysis
  • Descriptive — what happened: arrivals, occupancy, spend, capacity, conversion and geographic distribution.
  • Diagnostic — why it happened: relationships among campaigns, prices, connectivity, events, weather, availability and performance.
  • Predictive — what may happen: forecasts of demand, congestion, cancellations, resource consumption and staffing needs.
  • Prescriptive — what action may help: recommendations for capacity, schedules, promotion, alternative routes or resource allocation, subject to human review.

A predictive model does not replace judgment. It estimates probabilities based on historical data and assumptions. It must be compared with actual outcomes, recalibrated and retired when it no longer adds accuracy or produces undesirable effects.

5.4. Turning data into savings and efficiency

Value should be visible in specific processes. Measurable benefits may include:

  • Fewer staff hours spent collecting and reconciling files.
  • Fewer repetitive enquiries because schedules and incidents are updated across channels.
  • Better staffing through demand forecasts.
  • Lower energy, water or fuel consumption by connecting demand and operations.
  • Less idle capacity and higher conversion through current inventory.
  • Faster response to congestion, incidents and mobility changes.
  • Higher visitor spend or length of stay when recommendations connect demand with relevant local supply.
5.5. Calculating return on investment

Return must be defined at the use-case stage, not after the platform has been built. A basic formula is:

ROI = [(annual economic benefits − annual costs) ÷ initial investment] × 100

Benefits may include saved labor, lower operating costs, incremental revenue, avoided losses and released capacity. Costs should include development or licenses, integration, infrastructure, security, maintenance, training and change management.

Illustrative example: an integration requires an initial USD 120,000 investment. During the first year it produces USD 55,000 in operating savings and USD 45,000 in incremental margin, with USD 25,000 in annual operating cost. Net annual benefit is USD 75,000. First-year ROI is 62.5%, and simple payback is approximately 19 months. These figures are illustrative; each destination must use its own baseline and measure attributable results.

Financial ROI should be complemented by public-value indicators: response time, satisfaction, accessibility, flow dispersion, avoided emissions, resource consumption per visitor and participation by small enterprises.

5.6. Measurement design

Attribution requires a pre-implementation baseline, a target, an observation period and, where feasible, comparison with non-intervention periods, areas or groups. Dashboards should distinguish activity metrics — API calls, users and records processed — from outcome metrics — savings, revenue, satisfaction and incident reduction. Activity demonstrates use; outcomes demonstrate value.

6. Destination use cases

6.1. Experience catalogue and inventory

An experience API can consolidate schedules, availability, rates, accessibility, location and languages for museums, tours and attractions. The official website, an app, a hotel or an agency can consume the same catalogue. OpenTravel Alliance provides sector references that help reduce incompatible interfaces.

6.2. Capacity and visitor-flow management

Sensors, ticketing and mobility data can feed an occupancy service. Destination channels can identify congested areas and suggest alternative times or routes. A predictive model can anticipate pressure, but operating protocols must define who receives the alert and what action follows.

6.3. Integrated mobility

APIs can combine public transport, shared services, parking, taxis and walking routes. Information integration should generally precede route planning and integrated payment because each level requires greater commercial and technical coordination.

6.4. Digital destination card

A digital card can combine transport, attractions and discounts. Identity, payment, issuance, validation and settlement may evolve independently. The principal challenges are often commercial and operational: revenue allocation, fraud prevention, support and reconciliation.

6.5. Analytics and AI recommendations

A recommendation service can propose routes based on interests, weather, schedules, distance and capacity. Destinations should test whether clear business rules create sufficient value before using machine learning. Models require representative data, monitoring and bias controls.

6.6. Immersive content

Museums and heritage sites can publish georeferenced audio, augmented-reality and historical content. Separating the content repository from the presentation channel allows the same asset to be reused and updated.

6.7. CRM and visitor relationships

An integration layer can connect forms, campaigns, surveys and customer service. Each field should have a defined purpose, retention period and action that improves the visitor experience.

6.8. Sustainability and resource management

Mobility, water, energy, waste and occupancy data can feed dashboards and alerts. Value emerges when measurement changes decisions: spreading demand, adjusting lighting, planning collection or communicating lower-impact alternatives.

7. Reference architecture

A modular smart-destination architecture connecting tourism services with applications and partner platforms.

A useful destination architecture can be organized into six layers. This is consistent with the layered platform logic and UNE standards summarized by SEGITTUR.

7.1. Existing sources and systems

Most destinations already operate through a fragmented combination of hotel PMS, reservation platforms, ticketing, CRM, transport systems, municipal records, sensors, weather services and external providers. An API strategy should not begin by replacing this technology estate. It should identify which information has operational or commercial value, who manages it, how often it changes and under which conditions it may be used.

Connectors and adapters can translate information from legacy or proprietary systems into common contracts. A hotel, museum or transport operator can retain its technology while contributing availability, capacity, schedules or incidents. Smaller organizations without integration capabilities may use DMO-provided forms, shared portals or managed connectors.

Economic value comes from avoiding duplicate entry, reducing reconciliation and extending the useful life of existing investments. Progress should be measured through integration time, manual hours eliminated, update frequency, error rate and number of connected organizations.

7.2. Integration and events

This layer coordinates information movement through direct exchanges, queues, events and batch processes. When a booking is created, capacity changes or a mobility incident occurs, the event can be published once so that authorized services react. This reduces individual connections between every pair of systems and lowers the cost of onboarding new participants.

Data timeliness should match the decision. A closure alert may require seconds or minutes; consolidated expenditure may be processed at the end of the day. Designing every connection as real time raises cost without necessarily creating value. The destination must define priority, delay tolerance, retry procedures and accountability when an exchange fails.

Relevant indicators include propagation time, failed messages, duplicates, recovered incidents and reduction in point-to-point integrations. Technical improvement matters only when it produces more timely information or fewer operating disruptions.

7.3. Domain capabilities

Domain capabilities represent recognizable business functions: catalogue, availability, reservations, payments, profiles and consent, notifications, incidents and analytics. Every capability needs a purpose, owner and clear rules. Its boundary should reflect the decision or process it controls rather than an arbitrary quantity of code.

A reservation service may validate availability and confirm a transaction, while separate services manage payment and notification. Separation may be useful when those functions use different providers, security levels or demand patterns. If they always change together, distribution adds coordination without creating real autonomy.

The DMO should assess each capability by volume, criticality, rate of change, dependency and cost. Measures include release time, failures by service, processed capacity, cost per transaction and the percentage of changes that can be deployed without affecting other components.

7.4. API management and governance

API management turns isolated interfaces into a governed portfolio. It includes gateway, catalogue, documentation, authentication, authorization, traffic control, versions, metrics and policies. It also defines who may publish an API, who approves changes and how an old version is retired without interrupting users.

Public, partner and internal APIs need different rules. An event calendar may be open; property occupancy may be shared only in aggregate; payment operations require strict controls. Classification should reflect sensitivity, impact and purpose rather than simply whether the provider is public or private.

A developer and partner portal can reduce onboarding time by providing documentation, examples, test credentials and support contacts. Performance can be measured through average onboarding time, completed integrations, security incidents, usage by API, active legacy versions and service-level compliance.

7.5. Data, analytics and intelligence

The analytical environment combines historical and operational data with quality controls, metadata and lineage. It should not copy every transactional database indiscriminately. Only necessary variables should be received, with purpose, frequency, aggregation and retention clearly defined.

This layer turns dispersed records into comparable indicators. It can relate occupancy to connectivity, weather, campaigns, events, mobility and resource use. Dashboards, statistical analysis and predictive models are built on that foundation. Results should disclose coverage, assumptions, error margins and update dates to avoid false precision.

Value is demonstrated when analysis changes a decision: adjusting staff, reallocating campaigns, anticipating congestion or reducing consumption. Measures should include forecast accuracy, time from data to decision, users applying the insight, savings obtained and the gap between predicted and observed outcomes.

7.6. Channels and partners

Websites, apps, kiosks, assistants, information centers, OTAs, operators and third parties consume published services. Separating channels from capabilities avoids maintaining a different version of schedules, content or availability for each touchpoint. A correction in the authorized source can propagate to all connected channels.

Consistency does not mean every channel must be identical. A public display needs short messages; an app may offer personalization; a service agent requires more detail. The API provides a common base while each channel adapts presentation to its context and audience.

Performance should be measured through channel coverage, information consistency, conversion, update time, accessibility and the cost of launching a new touchpoint. The architecture creates value when new experiences can be introduced without duplicating content or integration work.

8. Expected outcomes and conditions

Continuity and seasonal capacity

Events and peak periods create uneven pressure on search, reservations, payments, mobility and service. A modular architecture can add capacity where it is needed and isolate selected failures. Decomposition alone, however, does not guarantee resilience; redundancy, automation, recovery testing, backups and agreed service objectives are required.

Outcomes should be measured through availability, recovery time, completed peak-period transactions and avoided loss. For a DMO, the question is not how many technical instances were activated, but whether the visitor could search, book or travel when demand was highest.

Speed of change

Teams with clear ownership can modify a capability without coordinating a large release. This helps destinations correct schedules, onboard a provider or test recommendations. The advantage disappears when every change still requires several services to be updated together; distribution then retains its cost but loses its autonomy.

Speed should be assessed through request-to-production time, release frequency, change-failure rate and coordination hours. More releases are not the objective in themselves; the goal is to respond faster to market or territorial needs.

Reuse

One API can supply official websites, apps, hotels, operators and new partners. Reuse prevents every project from renegotiating formats, building connectors and maintaining another copy of the same information.

Savings can be estimated by comparing the cost of one shared integration with the historical cost of individual developments. Other measures include consumers per API, percentage of components reused and onboarding time for a new channel. An API without consumers produces no return, even when it is technically well designed.

Less visitor friction

Consistent information and connected processes reduce unnecessary steps. A visitor can check availability, book, pay and receive instructions without repeatedly supplying the same information. Contradictions among the official site, the property and transport providers can also be reduced.

Benefits should be measured from the user experience: completion time, abandonment, conversion, complaints, satisfaction, accessibility and first-contact resolution. The number of APIs is an activity metric; reduced visitor effort is an outcome metric.

Total cost

Microservices do not necessarily reduce costs. They may reduce the cost of changing mature capabilities or scaling selected components, but they increase investment in automation, security, observability, testing and skills. In small projects, this operating premium may exceed the benefits.

Assessment should use total cost of ownership: design, licenses, infrastructure, integration, support, upgrades, training and eventual replacement. The right choice may be a commercial platform, modular monolith or progressive combination. Architecture should be justified by savings, revenue, avoided risk or released capacity rather than technology popularity.

9. Risks to manage

  • Weak governance: APIs deteriorate without accountable data and service owners.
  • Semantic quality: interoperability requires common definitions and identifiers.
  • Privacy: location and behavioral data require applicable legal controls, minimization and limited retention.
  • Cybersecurity: the OWASP API Security Top 10 covers authorization, authentication, configuration, inventory and third-party API risks.
  • Vendor dependency: contracts should support portability and data export.
  • Operational complexity: distributed systems require end-to-end observability and automation.
  • Digital exclusion: digital services should complement accessible alternatives.

10. Implementation roadmap

  1. Select a verifiable problem: define users, owners and outcome metrics before selecting technology.
  2. Inventory systems and agreements: document sources, ownership, quality, rights and restrictions.
  3. Design contracts and governance: establish common models, security, service levels, versions and partner onboarding.
  4. Build a minimum viable product: publish one or two APIs and connect them to a real channel using proportionate architecture.
  5. Measure and adjust: evaluate use, latency, error, data freshness and tourism outcomes.
  6. Scale by capability: separate only the capabilities that require independent scale or change cycles.

11. Executive performance indicators

  • API availability, latency and error rate.
  • Percentage of data updated within the agreed period.
  • Active partners and average onboarding time.
  • Reduction in manual processing and service time.
  • Conversion from enquiry to booking or purchase.
  • Temporal and spatial distribution of visitors.
  • Satisfaction, accessibility and incident resolution.
  • Energy, mobility or waste indicators linked to the use case.
  • Total cost per transaction or service.
  • Financial ROI, payback period and net annual benefit.

12. When are microservices appropriate?

Microservices are more reasonable when capabilities have different rates of change, several teams need autonomy, selective scaling is important or domain boundaries are well understood. They may also support gradual modernization of a legacy system.

They are usually not the first choice when the product is small, one team owns everything, the domain is still changing rapidly, or automation and monitoring are immature. A modular monolith with well-designed APIs can deliver much of the value with less complexity.

Conclusion

APIs turn isolated systems into reusable capabilities. Microservices can add autonomy and scale when a destination has sufficient complexity and operational maturity. Competitive advantage, however, does not reside in architecture alone.

A destination becomes smarter when every relevant organization can participate at an appropriate level, data are collected with purpose and quality, analysis informs specific actions, and results are measured in savings, efficiency, revenue and public value. The best platform is not the one with the most components; it is the one that reduces friction, improves decisions and strengthens the territory.

Sources and further reading

  1. SEGITTUR — Smart Destinations Platform.
  2. SEGITTUR — Smart Destination Standardization.
  3. SEGITTUR — Tourism Data Space.
  4. OpenAPI Initiative — OpenAPI Specification.
  5. IETF / RFC Editor — RFC 6749 and RFC 9700.
  6. OWASP — API Security Top 10, 2023.
  7. European Commission — GDPR principles.
  8. OpenTravel Alliance.
  9. Martin Fowler — Microservice Trade-Offs.
  10. OpenTelemetry — Observability Primer.
  11. Newman, Sam. Building Microservices. O’Reilly Media.

Oferta, demanda y elasticidad: cómo equilibrar volumen, precio y distribución en aviación y hotelería


Este artículo parte deliberadamente de conceptos básicos. Está dirigido, sobre todo, a quienes comienzan su carrera profesional en viajes, aviación, hotelería o turismo y empiezan a enfrentarse a términos como pricing, elasticidad, ocupación, yield, distribución, grupos o Revenue Management. En nuestra industria aprendemos muy pronto a vender habitaciones, asientos, paquetes y destinos, pero no siempre alguien se detiene a explicarnos la lógica económica que existe detrás de esas decisiones: por qué una tarifa sube o baja, cuándo conviene privilegiar volumen, por qué se protege inventario o qué valor aporta realmente un socio comercial. Mi intención es explicar esa lógica de manera sencilla y, sobre todo, conectarla con situaciones que ocurren todos los días en el negocio.


Oferta, demanda y elasticidad: cómo equilibrar volumen, precio y distribución en aviación y hotelería

Por Jorge Zárate

En aviación comercial y hotelería existe una paradoja fundamental: tanto un asiento de avión como una habitación de hotel tienen una vida comercial extremadamente corta. Si un vuelo despega con un asiento vacío o termina la noche con una habitación sin vender, esa capacidad desaparece y el ingreso potencial no puede recuperarse.

Esta característica convierte a la oferta, la demanda, la elasticidad y la gestión de capacidad en elementos centrales de la estrategia comercial. Pero existe una dimensión adicional: la distribución. Una aerolínea o un hotel no solamente deben decidir cuánto vender y a qué precio, sino también a quién vender, mediante qué canal y bajo qué condiciones económicas.

Aquí convergen los modelos B2C y B2B, el revenue management, los grupos, los tour operadores, las agencias de viajes y los diferentes socios de distribución.

La oferta tiene un límite

La ley de oferta y demanda establece, de manera simplificada, que cuando la demanda aumenta frente a una oferta limitada existe presión para incrementar precios; cuando la oferta supera la demanda disponible, los precios tienden a disminuir para estimular el consumo.

En aviación y hotelería, sin embargo, la oferta presenta una característica particular: la capacidad es relativamente rígida en el corto plazo.

Una aeronave puede disponer, por ejemplo, de 300 asientos. Un hotel puede tener 400 habitaciones. Una vez determinada esa capacidad para una fecha concreta, aumentarla inmediatamente resulta difícil.

Por ello, el problema comercial no consiste simplemente en llenar el avión o alcanzar 100% de ocupación hotelera.

El verdadero objetivo es:

vender la capacidad disponible al mejor ingreso total posible, utilizando la combinación adecuada de segmentos, precios y canales de distribución.

Una ocupación elevada no necesariamente significa una rentabilidad óptima.

La elasticidad explica cómo responde el consumidor

La elasticidad-precio de la demanda permite medir cuánto cambia la cantidad demandada ante una variación del precio.

Puede expresarse como:

Elasticidad = % cambio en cantidad demandada / % cambio en precio

Si una tarifa aumenta 10% y la demanda disminuye 15%, la elasticidad sería aproximadamente:

-15% / 10% = -1.5

En valor absoluto, 1.5 es mayor que 1, por lo que hablamos de una demanda elástica: el consumidor responde proporcionalmente más al cambio de precio.

Pero los pasajeros y huéspedes no tienen todos la misma elasticidad.

Un viajero corporativo que necesita estar en Madrid el martes para una reunión puede tener una sensibilidad relativamente baja al precio. Un turista que está considerando viajar a Madrid, Barcelona, Roma o París puede ser considerablemente más sensible.

Lo mismo sucede en hotelería. Un cliente que necesita hospedarse junto a un centro de convenciones durante un evento puede presentar menor elasticidad que un viajero vacacional que puede modificar hotel, destino o fecha.

Por ello, la demanda total debe entenderse como la suma de múltiples segmentos con diferentes elasticidades.

De la elasticidad al Revenue Management

Esta diferenciación constituye uno de los fundamentos del Revenue Management.

Una aerolínea puede tener un solo asiento físico, pero comercializarlo mediante diferentes tarifas, condiciones y canales.

Un hotel hace algo similar con una habitación.

La pregunta deja entonces de ser:

¿A qué precio vendo?

y se convierte en:

¿Cuánta capacidad debo reservar para cada segmento, a qué precio y mediante qué canal para maximizar el ingreso esperado?

Supongamos un vuelo con 300 asientos.

El operador podría enfrentar dos alternativas extremas:

  • vender rápidamente los 300 asientos a USD 500;
  • esperar exclusivamente pasajeros dispuestos a pagar USD 1,000.

Ninguna necesariamente maximiza ingresos.

La estrategia puede consistir en vender anticipadamente una parte de la capacidad mediante grupos y tour operadores, otra mediante tarifas promocionales B2C, conservar capacidad para viajeros individuales de mayor contribución y proteger determinados inventarios para demanda de última hora.

El resultado buscado es un mix óptimo de demanda, no simplemente máxima ocupación.

Los grupos como instrumento de volumen y reducción de riesgo

Los grupos tienen especial importancia en este modelo.

Para una aerolínea, hotel o resort, aceptar un grupo con meses de anticipación puede representar un precio unitario inferior al potencial precio futuro del cliente individual.

¿Por qué aceptarlo?

Porque el grupo aporta algo económicamente valioso: volumen y previsibilidad.

Un hotel puede asegurar 100 habitaciones durante cuatro noches. Una aerolínea puede colocar 80 asientos de un vuelo futuro. Ese volumen reduce incertidumbre y establece una base de ocupación sobre la cual posteriormente puede optimizarse el inventario restante.

El grupo funciona así como una especie de base load comercial.

Sin embargo, aceptar demasiado volumen a precios bajos genera otro riesgo: desplazar posteriormente demanda de mayor valor.

Aquí aparece uno de los conceptos fundamentales del revenue management: el costo de oportunidad de la capacidad.

Aceptar hoy 100 asientos a USD 600 puede resultar atractivo. Pero si posteriormente esos mismos asientos podían venderse a USD 1,100, la decisión tiene un costo.

Por eso el análisis de grupos debería considerar no solamente el tamaño del grupo, sino también:

tarifa + probabilidad de materialización + anticipación + estacionalidad + demanda esperada + capacidad disponible + ingreso incremental asociado.

B2C y B2B no deberían competir: cumplen funciones diferentes

Existe la tentación de pensar que la venta directa B2C es siempre más rentable porque elimina intermediarios.

No necesariamente.

El canal directo puede reducir determinados costos de distribución y proporcionar mayor control sobre precio, inventario y relación con el consumidor. Sin embargo, un socio B2B puede aportar algo que el proveedor difícilmente conseguiría con el mismo costo: demanda incremental, acceso a mercados, especialización, volumen y capacidad comercial.

Aquí se vuelve fundamental distinguir entre costo de distribución y valor de distribución.

Un tour operador especializado en Asia, por ejemplo, puede generar pasajeros que probablemente nunca habrían llegado directamente a la página de una determinada aerolínea.

Una agencia especializada en lujo puede colocar un resort entre clientes de alto poder adquisitivo.

Una TMC puede concentrar demanda corporativa recurrente.

Una OTA puede proporcionar exposición internacional y demanda en mercados donde el hotel tiene poca presencia comercial.

El intermediario deja entonces de ser simplemente un costo y se convierte en un generador de demanda.

El ecosistema proveedor–socio–cliente

Una estrategia sostenible requiere que las tres partes encuentren valor.

Proveedor → Socio comercial → Cliente

El proveedor —aerolínea u hotel— aporta producto, capacidad, inventario, servicio y estructura tarifaria.

El socio —tour operador, agencia, TMC, OTA, mayorista o plataforma— aporta distribución, conocimiento del mercado, acceso al consumidor, marketing y capacidad para agregar demanda.

El cliente aporta finalmente el ingreso que sostiene todo el sistema.

La relación funciona mejor cuando cada participante puede capturar una parte razonable del valor generado.

Si el proveedor reduce excesivamente el margen del distribuidor, éste puede dirigir su demanda hacia productos competidores.

Si el distribuidor exige descuentos demasiado agresivos, deteriora el yield y la rentabilidad del proveedor.

Y si ambos elevan excesivamente el precio final, la elasticidad puede provocar que el consumidor cambie de producto, fecha, proveedor o incluso destino.

Por tanto, la negociación B2B no debería reducirse a:

“¿Cuánto descuento me das?”

Una pregunta comercialmente más sofisticada sería:

“¿Qué demanda incremental puedes generar y cómo podemos compartir el valor económico creado?”

Un ejemplo: aerolínea + tour operador

Consideremos una aerolínea que dispone de capacidad hacia un destino internacional durante temporada baja.

La tarifa pública promedio podría ser USD 1,000, pero la demanda esperada solamente permitiría alcanzar 65% de ocupación.

Un tour operador propone producir 1,000 pasajeros durante la temporada a una tarifa negociada de USD 750.

A primera vista, el proveedor podría considerar que está sacrificando USD 250 por pasajero.

Pero esa comparación puede ser incorrecta.

La pregunta relevante es:

¿Esos 1,000 pasajeros habrían comprado de cualquier manera a USD 1,000?

Si la respuesta es no, el tour operador está aportando demanda incremental.

El análisis debe entonces considerar el ingreso adicional, costo marginal, riesgo de desplazamiento de pasajeros de mayor tarifa y contribución total.

La tarifa más baja puede ser económicamente racional si permite utilizar capacidad que probablemente habría quedado vacía.

El mismo principio en hotelería

Supongamos ahora un resort con 500 habitaciones y una ocupación prevista de 55% durante determinadas fechas.

Un tour operador solicita 100 habitaciones por noche durante una semana a una tarifa neta inferior al BAR —Best Available Rate— del hotel.

Aceptar el negocio puede reducir el ADR promedio, pero aumentar considerablemente los Room Nights y el ingreso total.

Además, el huésped puede generar ingresos adicionales mediante:

  • alimentos y bebidas;
  • spa;
  • experiencias;
  • upgrades;
  • transporte;
  • actividades;
  • consumo dentro de la propiedad.

Esto demuestra por qué una decisión basada exclusivamente en ADR puede resultar incompleta.

La variable relevante es la contribución económica total del cliente.

La distribución también debe administrarse como un portafolio

Así como el revenue management administra diferentes niveles tarifarios, la estrategia comercial debería administrar un portafolio de canales.

El proveedor puede combinar:

Direct B2C: mayor control sobre el cliente, precio, datos y experiencia.

Agencias de viajes: acceso especializado a clientes y mercados.

Tour operadores: volumen, paquetes y capacidad para estimular determinados destinos.

TMCs: demanda corporativa y recurrencia.

OTAs: alcance, visibilidad y capacidad de conversión digital.

Mayoristas y bedbanks: distribución B2B internacional y acceso a redes secundarias.

El objetivo no debería ser maximizar un canal, sino determinar qué canal genera mayor contribución incremental para cada mercado, temporada y segmento.

Del Revenue Management al Total Revenue Management

Esta lógica conduce hacia un concepto más amplio: Total Revenue Management.

El análisis ya no debería limitarse a tarifa y ocupación.

En aviación pueden incorporarse ingresos por equipaje, selección de asiento, upgrades, servicios adicionales y productos asociados.

En hotelería deben considerarse habitaciones, alimentos y bebidas, spa, eventos, actividades y otros consumos.

Esto cambia nuevamente la interpretación de la elasticidad.

Un cliente atraído mediante una tarifa inicial competitiva puede tener un valor económico total considerablemente superior al precio inicial pagado.

La decisión comercial debería evaluar cada vez más el Total Customer Value, y no solamente el precio de la transacción inicial.

El equilibrio final

La ley de oferta y demanda sigue siendo la base económica del sistema. La elasticidad permite comprender cómo responde cada segmento a los cambios de precio. El revenue management convierte esa información en decisiones de inventario y pricing. Los grupos aportan volumen y reducen incertidumbre. Y la distribución conecta esa capacidad con mercados que el proveedor no necesariamente puede desarrollar eficientemente por sí mismo.

Por ello, B2C y B2B no deberían plantearse como modelos opuestos.

Son componentes complementarios de una misma arquitectura comercial.

El desafío para aerolíneas y hoteles consiste en identificar qué demanda desean estimular, cuánto inventario asignar, qué precio aceptar, qué canal utilizar y qué capacidad proteger para demanda futura de mayor valor.

Para el socio comercial, el reto consiste en demostrar que no solamente solicita mejores condiciones, sino que aporta volumen incremental, acceso a mercados, conocimiento del consumidor y capacidad de conversión.

Cuando esa relación está correctamente diseñada, el beneficio deja de ser un juego de suma cero.

El proveedor mejora utilización de capacidad e ingresos. El socio obtiene un margen que remunera su función de distribución. El consumidor recibe una propuesta competitiva. Y el destino obtiene mayor flujo de visitantes y derrama económica.

En última instancia, optimizar ingresos no significa vender siempre más caro ni llenar toda la capacidad al menor precio.

Significa encontrar el punto donde precio, volumen, elasticidad, capacidad y distribución producen conjuntamente el mayor valor posible.

¿Llevamos este análisis al siguiente nivel?

Podemos convertir estos conceptos en un modelo cuantitativo y analizar, por ejemplo, qué sucede con 300 asientos de una aerolínea o 300 habitaciones de un hotel cuando modificamos precio, volumen, elasticidad, participación B2B/B2C y capacidad disponible. El objetivo sería pasar de entender el concepto a medir económicamente cada decisión.

Si este tipo de análisis te resulta útil, me gustaría saberlo. ¿Qué modelo o situación real de aviación, hotelería o distribución te gustaría que analizáramos en el próximo artículo?

Strategic Management

Jorge Zárate / October 2025

Strategic Management for Travel and Tourism Leaders

Introduction: A Lifelong Journey Informed by Strategy

After thirty-five years devoted to the vibrant, challenging, and ever-evolving travel and tourism industry, I have witnessed booms, busts, disruptions, and transformations. From the dawn of the internet to the recent global pandemic, I have learned that success in this sector is not merely a product of passion or luck, but the result of deliberate, insightful, and well-executed strategy. It is with this hard-earned perspective that I have turned to one of the most respected texts in the field of business strategy, Strategic Management: Competitiveness and Globalization, Concepts and Cases by Hitt, Ireland, and Hoskisson. My purpose is clear: to analyze and translate their comprehensive strategic management process into a practical playbook for my peers and successors in travel and tourism.

This article is the culmination of that effort. It moves beyond academic theory to provide a actionable framework for travel agents, tour operators, hoteliers, destination managers, and all tourism professionals. The volatile and interconnected nature of our global industry demands a disciplined approach to navigate competition, leverage globalization, and secure lasting success. By applying the integrated model from Hitt et al. (2021) to the specific contexts we face daily, we can move from being reactive participants to proactive, strategic architects of our own destinies. Consider this a manual,a guide built on proven strategic principles and decades of industry experience,designed to equip you with the tools not just to survive, but to thrive and become a successful agent of change in the world of travel.

The Integrated Strategic Management Process: A Blueprint for Tourism

Hitt et al. (2021) present strategic management as an integrated, ongoing process rather than a series of disconnected exercises. This process model, which flows from analysis to action to outcomes, is perfectly suited to the interconnected nature of tourism. The model begins with a rigorous analysis of strategic inputs, leading to the formulation and implementation of strategic actions, all with the goal of achieving strategic outcomes,primarily, strategic competitiveness and above-average returns.

Part 1: Strategic Inputs – Analyzing the Terrain

The first phase involves a clear-eyed assessment of the internal and external environments, a foundational step for any tourism enterprise.

External Analysis

A comprehensive external analysis examines the general, industry, and competitor environments. The general environment, often analyzed through a PESTEL (Political, Economic, Socio-cultural, Technological, Environmental, Legal) framework, is particularly volatile for tourism.

  • Political & Economic: Visa regulations, geopolitical stability, and trade policies can open or close markets overnight. Economic factors like inflation, exchange rates, and disposable income directly dictate travel propensity. A tour operator specializing in luxury travel to Europe, for instance, must constantly monitor currency fluctuations and economic forecasts in key source markets like North America and Asia.
  • Socio-cultural: The rise of the “experience economy,” where consumers value unique, authentic, and Instagram-worthy moments over material goods, is a dominant trend (Pine & Gilmore, 1999). There is also a growing demand for transformative travel, where the goal is personal growth and cultural immersion. Furthermore, the increasing awareness of overtourism is pushing destinations and companies to consider more responsible models.
  • Technological: This is a primary disruptive force. The ascendancy of Airbnb disrupted the hotel industry, while Google Travel and Booking.com consolidated immense power in the distribution channel. Emerging technologies like Artificial Intelligence (AI) for personalized travel planning, the Internet of Things (IoT) for smart hotel rooms, and virtual reality for destination previews are reshaping the customer journey from inspiration to post-trip sharing.
  • Environmental: Climate change is a dual-edged sword. It poses a physical threat to low-lying coastal resorts and ski destinations, while simultaneously driving demand for sustainable and low-impact travel options. The flight-shaming movement and consumer preference for businesses with strong environmental, social, and governance (ESG) credentials are becoming significant factors.

The heart of external analysis is the industry environment, best understood through Michael Porter’s Five Forces model (Porter, 1980).

  • Threat of New Entrants: Barriers to entry can be low for online travel agencies (OTAs) or small tour guides, but are exceptionally high for airlines or large cruise lines due to capital requirements and regulation.
  • Bargaining Power of Buyers: The power of individual travelers has never been greater, thanks to price-comparison websites and social media reviews. Large corporate travel departments also wield significant power in negotiating rates.
  • Bargaining Power of Suppliers: This is high for key assets. Airlines are dependent on aircraft manufacturers (Boeing, Airbus) and constrained by limited airport slots. Hotels are at the mercy of global distribution systems (GDS) and OTAs for customer acquisition.
  • Threat of Substitute Products: Videoconferencing is a substitute for business travel. A “staycation” or a local experiential purchase can substitute for a distant vacation.
  • Rivalry Among Existing Competitors: Fierce, often based on price, as seen in the constant price wars between airlines and OTAs.

Internal Analysis

While the external environment presents opportunities and threats, the internal environment reveals a firm’s strengths and weaknesses. The Resource-Based View (RBV) of the firm, a central concept in Hitt et al. (2021), argues that competitive advantage stems from possessing valuable, rare, inimitable, and non-substitutable (VRIN) resources and capabilities.

For a tourism company, these can be tangible, such as a fleet of new, fuel-efficient aircraft or a prime beachfront property. However, sustainable advantage more often lies in intangible resources:

  • Human Capital: A highly trained, empathetic staff that delivers exceptional service can be a powerful differentiator for a hotel chain or a tour company.
  • Brand Reputation: Brands like Four Seasons or Abercrombie & Kent have built reputations for quality and exclusivity that are difficult for competitors to replicate.
  • Intellectual Property: Proprietary booking algorithms, unique itineraries, or patented technology.
  • Organizational Culture: A culture of innovation and agility, as seen in companies like Airbnb, which allows them to pivot and adapt quickly to market changes.

A SWOT analysis (Strengths, Weaknesses, Opportunities, Threats) is a useful tool to synthesize the findings from the internal and external analyses, creating a clear strategic picture.

Part 2: Strategic Actions – Formulating and Executing the Plan

With a clear understanding of the strategic inputs, a firm can formulate its strategic actions.

Business-Level Strategy

This concerns how a firm competes in a specific market or industry segment. Hitt et al. (2021) outline the generic strategies of cost leadership, differentiation, and focus.

  • Cost Leadership: This strategy involves being the low-cost producer in the industry. Ryanair and EasyJet are quintessential examples in the airline sector. They achieve this through a no-frills service model, standardized fleets, and aggressive cost control on everything from airport fees to staff costs. In tourism, large OTAs like Booking.com also compete on cost (or rather, price) by offering the broadest inventory and leveraging scale to secure competitive rates.
  • Differentiation: This strategy involves creating a product or service that is perceived as unique industry-wide. The Ritz-Carlton Hotel Company differentiates itself through its legendary service and “Gold Standards.” Intrepid Travel differentiates by offering small-group, sustainable, and culturally immersive adventures that are distinct from mass-market tours. Differentiation allows a company to command a premium price.
  • Integrated Cost Leadership/Differentiation: This hybrid approach, increasingly common, is enabled by technology. For instance, Virgin Atlantic attempts to offer some differentiated, stylish amenities while maintaining a competitive cost structure on its routes.

Use Case 1: “EcoLodge Andes” – Differentiation through Sustainability

Imagine “EcoLodge Andes,” a small hotel in Peru. Its external analysis reveals a strong opportunity in the growing market for sustainable travel and a threat from larger, conventional resorts. Its internal analysis identifies key strengths: a unique, remote location, deep partnerships with local communities, and authentic expertise in the local ecology (VRIN resources).

Its strategic action is a focused differentiation strategy. It targets a specific segment of travelers,affluent, environmentally conscious ecotourists. It formulates its strategy around its unique value proposition: unparalleled access to nature with a minimal environmental footprint. This is executed through:

  • Structure: A flat, empowered organizational structure where local guides are key decision-makers.
  • Controls: Rigid environmental controls (e.g., zero single-use plastic, closed-loop water systems) monitored and reported transparently.
  • Strategic Leadership: A leader who is both a savvy businessperson and a genuine conservation advocate, ensuring the strategy is authentically embedded in the culture.

By doing so, EcoLodge Andes avoids direct price competition with large resorts and builds a loyal customer base willing to pay a premium for its unique, values-aligned experience.

Corporate-Level Strategy

This concerns the question, “What businesses should we be in?” For diversified tourism conglomerates, this involves decisions about portfolio management.

  • Related Diversification: Creating value through economies of scope and sharing activities across business units. The TUI Group is a prime example. It owns airlines, hotels, cruise ships, and tour operators. This vertical and horizontal integration allows TUI to control the entire customer experience, capture revenue at multiple points, and cross-sell services, creating synergies that a standalone company cannot easily match.
  • Unrelated Diversification: This involves operating businesses that are not related, creating value primarily through financial economies. This is less common in pure tourism but could involve a hotel chain owning an unrelated real estate development arm.

International Strategy

Given its inherently global nature, the choice of international strategy is critical for tourism firms. Hitt et al. (2021) discuss the balance between global integration and local responsiveness.

  • Global Standardization: Seeking cost reduction through standardized operations worldwide. Marriott International employs this to a large degree, ensuring a consistent level of quality and service across its global portfolio, which creates efficiency and builds brand trust.
  • Multi-domestic Strategy: Emphasizing customization to fit local markets. A smaller tour company might use this strategy, tailoring its offerings in Japan (e.g., more group-oriented, meticulous itineraries) versus those in Australia (e.g., more independent, adventure-focused).
  • Transnational Strategy: The ideal, but difficult-to-achieve balance of global efficiency and local responsiveness. Airbnb attempts this: it has a globally standardized platform and brand, but its offerings are hyper-local (unique homes and experiences) and it must navigate vastly different local regulations in each market.

Use Case 2: “GlobalAir” – Navigating the Turbulence of International Strategy

“GlobalAir,” a hypothetical full-service carrier, faces intense pressure from Gulf carriers (global cost leaders) and regional low-cost carriers. Its external analysis shows high supplier power (aircraft manufacturers) and intense rivalry. Internally, its strengths are a strong brand and a valuable portfolio of landing slots at a major hub airport.

Its strategic action involves a multi-domestic partnership strategy. Recognizing it cannot compete globally on cost alone, it forgoes a pure global standardization model. Instead, it joins a global airline alliance (e.g., Star Alliance) to gain global reach and feed traffic through its hub. Simultaneously, it forms deep codeshare and joint venture partnerships with key airlines in specific geographic markets (e.g., a partner in Asia, another in South America). This allows GlobalAir to offer seamless global networks (achieving some global integration) while allowing its partners to handle local marketing, sales, and customer service, ensuring local responsiveness. This collaborative approach, leveraging strategic alliances, is a key tool for competing in the capital-intensive airline industry.

Part 3: Strategic Outcomes and the Critical Role of Implementation

Formulating a brilliant strategy is futile without effective implementation. This involves the nuts and bolts of organizational structure, controls, and strategic leadership.

  • Organizational Structure: A rigid, hierarchical structure will stifle the innovation required in today’s tourism market. Companies are moving toward flatter, more organic structures that empower frontline employees,the hotel concierge, the flight attendant,to solve customer problems creatively. For a large conglomerate like TUI, a multidivisional structure is necessary to manage its diverse portfolio.
  • Controls: Strategic controls are subjective and concerned with the long-term effectiveness of the strategy (e.g., is our brand perception improving?). Financial controls are objective and focus on short-term performance (e.g., revenue per available room). A balanced scorecard that includes both financial metrics and non-financial indicators like customer satisfaction, employee engagement, and environmental impact is essential.
  • Strategic Leadership: The leaders of tourism firms must be visionaries who can navigate complexity and foster an entrepreneurial culture. They are responsible for making the critical resource allocation decisions,should we invest in a new AI platform or renovate our flagship hotel? They must also manage the firm’s portfolio of resources and build an effective organizational culture. The success of companies like Airbnb can be directly attributed to the strategic leadership of its founders, who envisioned and executed a disruptive new model for travel accommodation.

Use Case 3: “Heritage City Tourism Board” – Implementing a Destination Management Strategy

A city known for its UNESCO World Heritage site faces the strategic outcome of overtourism: declining resident quality of life, damage to monuments, and a poor visitor experience,a clear failure to achieve sustainable competitiveness. The strategic input analysis reveals the threat is existential.

The city’s strategic action is to implement a comprehensive destination management strategy. The formulation involves policies like visitor caps, timed ticketing, and promoting off-season travel. However, the implementation is the true challenge.

  • Structure: A new public-private governance structure is created, bringing together hotels, tour operators, transport companies, and resident associations.
  • Controls: New strategic controls are implemented, shifting the key performance indicator from pure visitor numbers to metrics like average visitor expenditure, dispersal to lesser-visited neighborhoods, and resident satisfaction scores.
  • Strategic Leadership: The mayor and tourism board CEO provide the leadership to build consensus among often conflicting stakeholders (hoteliers wanting more tourists vs. residents wanting fewer). They must communicate the long-term vision of a sustainable, high-quality destination, even if it involves short-term pain.

The strategic outcome, achieved through diligent implementation, is the transition from a volume-based to a value-based tourism model, ensuring the city’s cultural and economic longevity.

Conclusion: Your Strategic Playbook for the Future

The travel and tourism industry stands at a critical juncture. The forces of globalization, technological disruption, and environmental change are not temporary disruptions but permanent features of the landscape. In this environment, the integrated strategic management process championed by Hitt, Ireland, and Hoskisson provides an indispensable roadmap for success. It demands that managers move beyond reactive tactics and embrace a disciplined cycle of analysis, formulation, and execution. From the boutique EcoLodge crafting a focused differentiation strategy to the global airline navigating complex international alliances, the principles remain the same: understand your environment, leverage your unique resources, and build an organization capable of turning strategy into reality.

This is the core of the playbook. Use it to conduct your own rigorous analysis. Use it to choose a clear competitive position rather than getting stuck in the middle. Use it to forge strategic alliances that amplify your reach. Most importantly, use it to lead with vision and execute with precision. For those who master this process, the reward is not merely survival, but the ability to thrive and shape the future of travel, achieving strategic competitiveness that is both profitable and sustainable. Let this manual be your guide as you write your own success story in the next chapter of our incredible industry.


References

Hitt, M. A., Ireland, R. D., & Hoskisson, R. E. (2021). Strategic management: Competitiveness and globalization: Concepts and cases (13th ed.). Cengage Learning.

Pine, B. J., & Gilmore, J. H. (1999). The experience economy: Work is theatre & every business a stage. Harvard Business School Press.

Porter, M. E. (1980). Competitive strategy: Techniques for analyzing industries and competitors. Free Press.